Grundlæggende statistik
| Institutionelle ejere | 551 total, 518 long only, 1 short only, 32 long/short - change of -3,93% MRQ |
| Gennemsnitlig porteføljeallokering | 0.3220 % - change of -19,00% MRQ |
| Institutionelle aktier (lange) | 677.658.423 (ex 13D/G) - change of -44,38MM shares -5,65% MRQ |
| Institutionel værdi (lang) | $ 7.938.934 USD ($1000) |
Institutionelt ejerskab og aktionærer
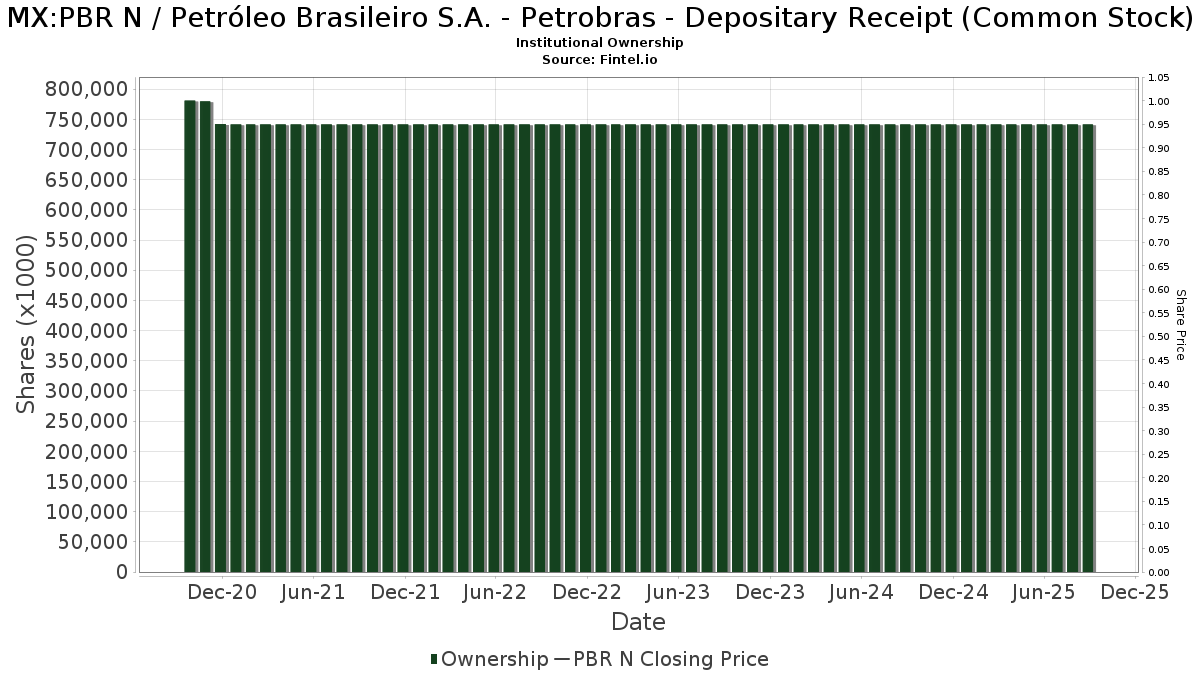
Petróleo Brasileiro S.A. - Petrobras - Depositary Receipt (Common Stock) (MX:PBR N) har 551 institutionelle ejere og aktionærer, der har indsendt 13D/G- eller 13F-formularer til Securities Exchange Commission (SEC). Disse institutioner har i alt 677,658,423 aktier. Største aktionærer omfatter GQG Partners LLC, GSIHX - Goldman Sachs GQG Partners International Opportunities Fund Class A Shares, Capital International Investors, Baillie Gifford & Co, Invesco Ltd., Schroder Investment Management Group, Lazard Asset Management Llc, Itau Unibanco Holding S.A., ARGA Investment Management, LP, and Fisher Asset Management, LLC .
Petróleo Brasileiro S.A. - Petrobras - Depositary Receipt (Common Stock) (BMV:PBR N) institutionel ejerskabsstruktur viser aktuelle positioner i virksomheden efter institutioner og fonde, samt seneste ændringer i positionsstørrelse. Større aktionærer kan omfatte individuelle investorer, investeringsforeninger, hedgefonde eller institutioner. Skema 13D angiver, at investoren besidder (eller besidder) mere end 5 % af virksomheden og har til hensigt (eller har til hensigt at) aktivt at forfølge en ændring i forretningsstrategi. Skema 13G indikerer en passiv investering på over 5%.
Fondens stemningsscore
Fund Sentiment Score (fka Ownership Accumulation Score) finder de aktier, der bliver mest købt af fonde. Det er resultatet af en sofistikeret, multi-faktor kvantitativ model, der identificerer virksomheder med de højeste niveauer af institutionel akkumulering. Scoringsmodellen bruger en kombination af den samlede stigning i oplyste ejere, ændringerne i porteføljeallokeringer i disse ejere og andre målinger. Tallet går fra 0 til 100, hvor højere tal indikerer et højere niveau af akkumulering for sine jævnaldrende, og 50 er gennemsnittet.
Opdateringsfrekvens: Dagligt
Se Ownership Explorer, som giver en liste over højest rangerende virksomheder.
AI+ Ask Fintel’s AI assistant about Petróleo Brasileiro S.A. - Petrobras - Depositary Receipt (Common Stock).
Select a question to share a public post with an AI-crafted answer.
Thinking of good questions…
13F og NPORT arkivering
Detaljer om 13F-arkivering er gratis. Detaljer om NP-ansøgninger kræver et premium-medlemskab. Grønne rækker angiver nye positioner. Røde rækker angiver lukkede positioner. Klik på linket ikon for at se den fulde transaktionshistorik.
Opgrader
for at låse premium-data op og eksportere til Excel ![]() .
.
| Fil dato | Kilde | Investor | Type | Gennemsnitlig pris (Øst) |
Aktier | Δ Aktier (%) |
Rapporteret Værdi ($1000) |
Δ Værdi (%) |
Port Alloc (%) |
|
|---|---|---|---|---|---|---|---|---|---|---|
| 2025-11-05 | 13F | Wellington Shields Capital Management, LLC | 0 | -100,00 | 0 | |||||
| 2026-02-17 | 13F | Citadel Advisors Llc | Put | 1.703.300 | 22,67 | 20.184 | 14,83 | |||
| 2026-01-14 | 13F | Jfs Wealth Advisors, Llc | 508 | 9,01 | 6 | 20,00 | ||||
| 2026-01-22 | 13F | V-Square Quantitative Management LLC | 6.489 | 77 | ||||||
| 2026-02-17 | 13F | Optiver Holding B.V. | 2.223.170 | -12,33 | 26.345 | -17,94 | ||||
| 2026-02-05 | 13F | Park Square Financial Group, LLC | 513 | 7 | ||||||
| 2026-02-17 | 13F | Optiver Holding B.V. | Call | 7.063.400 | -9,11 | 83.701 | -14,92 | |||
| 2026-01-20 | 13F | Ascent Group, LLC | 14.014 | -22,26 | 166 | -27,19 | ||||
| 2026-02-14 | 13F | Silver Grove Financial Group, Inc. | 2.000 | 24 | ||||||
| 2026-02-17 | 13F | Hilltop Holdings Inc. | 12.146 | -4,29 | 144 | -10,62 | ||||
| 2025-11-14 | 13F | Turim 21 Investimentos Ltda. | 0 | -100,00 | 0 | |||||
| 2026-01-26 | 13F | Moran Wealth Management, LLC | 535.044 | 17,99 | 6.340 | 10,43 | ||||
| 2026-02-17 | 13F | First Manhattan Co | 0 | -100,00 | 0 | |||||
| 2026-02-02 | 13F | Qrg Capital Management, Inc. | 36.280 | 1,08 | 430 | -5,51 | ||||
| 2026-02-11 | 13F | X-Square Capital, LLC | 11.463 | -46,59 | 0 | |||||
| 2025-11-17 | 13F | Perritt Capital Management Inc | 0 | -100,00 | 0 | -100,00 | ||||
| 2026-02-10 | 13F/A | Northwestern Mutual Wealth Management Co | 79.081 | -28,17 | 937 | -32,74 | ||||
| 2026-02-10 | 13F | KERR FINANCIAL PLANNING Corp | 14 | 0 | ||||||
| 2026-02-17 | 13F | Citadel Advisors Llc | 70.241 | 80,18 | 832 | 68,76 | ||||
| 2026-02-13 | 13F | Venture Visionary Partners LLC | 264.118 | 6,93 | 3.130 | 0,06 | ||||
| 2026-02-13 | 13F | Ieq Capital, Llc | 57.671 | 23,82 | 683 | 15,96 | ||||
| 2026-02-17 | 13F | Optiver Holding B.V. | Put | 10.087.400 | 27.920,56 | 119.536 | 28.025,88 | |||
| 2025-09-25 | NP | Dfa Investment Trust Co - The Emerging Markets Series This fund is a listed as child fund of Dimensional Fund Advisors Lp and if that institution has disclosed ownership in this security, then these positions will not be double counted when calculating total shares and total value | 142.561 | 0,00 | 1.816 | 12,87 | ||||
| 2026-01-21 | 13F | Newbridge Financial Services Group, Inc. | 1.725 | 6,15 | 20 | 0,00 | ||||
| 2026-02-13 | 13F | Journey Strategic Wealth Llc | 86.262 | -2,02 | 1.022 | -8,26 | ||||
| 2026-02-17 | 13F | Citadel Advisors Llc | Call | 1.312.600 | -32,80 | 15.554 | -37,10 | |||
| 2026-01-12 | 13F | Abound Wealth Management | 24 | 0,00 | 0 | |||||
| 2026-02-06 | 13F | Gsa Capital Partners Llp | 0 | -100,00 | 0 | |||||
| 2026-02-13 | 13F | Walleye Trading LLC | Call | 369.200 | 341,10 | 4.375 | 313,13 | |||
| 2026-01-15 | 13F | Allspring Global Investments Holdings, LLC | 1.395.841 | 5,63 | 16.638 | -0,23 | ||||
| 2026-01-28 | 13F | DekaBank Deutsche Girozentrale | 30.000 | 0,00 | 1 | |||||
| 2026-02-13 | 13F | Walleye Trading LLC | Put | 197.900 | 380,34 | 2.345 | 350,10 | |||
| 2025-10-30 | 13F | Simplicity Wealth,LLC | 0 | -100,00 | 0 | -100,00 | ||||
| 2026-02-06 | 13F | EverSource Wealth Advisors, LLC | 2.059 | -11,29 | 24 | -17,24 | ||||
| 2026-02-12 | 13F | Scotia Capital Inc. | 0 | -100,00 | 0 | |||||
| 2025-11-13 | 13F | Riggs Asset Managment Co. Inc. | 0 | -100,00 | 0 | |||||
| 2026-02-13 | 13F | USS Investment Management Ltd | 894.094 | 0,00 | 10.591 | -6,40 | ||||
| 2026-02-12 | 13F | Marex Group plc | 122.937 | 198,22 | 1.457 | 288,27 | ||||
| 2026-02-13 | 13F | Flow Traders U.s. Llc | 22.715 | 87,60 | 0 | |||||
| 2026-02-12 | 13F | StoneX Group Inc. | 15.442 | 185 | ||||||
| 2025-10-31 | 13F | Whittier Trust Co | 0 | -100,00 | 0 | -100,00 | ||||
| 2026-01-23 | 13F | Westside Investment Management, Inc. | 745 | 5,67 | 9 | 0,00 | ||||
| 2026-02-17 | 13F | one8zero8, LLC | 70.273 | 17.468,25 | 833 | 20.700,00 | ||||
| 2026-02-17 | 13F | Advisory Services Network, LLC | 29.984 | 2.507,30 | 355 | 2.630,77 | ||||
| 2026-02-06 | 13F | Payden & Rygel | 10.210 | 0,00 | 0 | |||||
| 2025-09-25 | NP | VEU - Vanguard FTSE All-World ex-US Index Fund ETF Shares | 995.895 | 0,00 | 12.688 | 12,84 | ||||
| 2026-02-09 | 13F | Mondrian Investment Partners LTD | 12.655.094 | 14,09 | 149.963 | 6,79 | ||||
| 2026-01-30 | 13F | Camden Capital, LLC | 250.000 | 0,00 | 2.962 | -6,41 | ||||
| 2026-02-02 | 13F | Ping Capital Management, Inc. | 392.100 | 46,31 | 4.646 | 36,97 | ||||
| 2025-11-14 | 13F | Consultiva Wealth Management, Corp. | 0 | -100,00 | 0 | |||||
| 2025-09-26 | NP | RTNAX - Tax-Managed International Equity Fund Class A | 709.831 | 24,00 | 9.043 | 39,94 | ||||
| 2026-02-17 | 13F | Masters Capital Management Llc | 0 | -100,00 | 0 | |||||
| 2026-02-13 | 13F | First National Bank Of Omaha | 347.795 | 4.125 | ||||||
| 2026-02-20 | 13F | Larch Capital Partners Llc | 632.032 | 7.714 | ||||||
| 2025-09-26 | NP | EPIN - Harbor International Equity ETF | 4.296 | 55 | ||||||
| 2026-02-13 | 13F | Clear Street Group Inc. | 41.348 | 490 | ||||||
| 2025-09-24 | NP | IMRFX - Columbia Global Opportunities Fund Class A | 35.368 | 44,86 | 451 | 63,64 | ||||
| 2026-02-04 | 13F | Pensionmark Financial Group, Llc | 19.365 | 26,39 | 186 | -4,15 | ||||
| 2026-02-11 | 13F | Group One Trading, L.p. | 1.535.545 | 9,35 | 18.196 | 2,36 | ||||
| 2026-02-13 | 13F | Wealth Alliance | 48.125 | -6,43 | 570 | -12,44 | ||||
| 2026-01-14 | 13F | Generali Investments CEE, investicni spolecnost, a.s. | 149.600 | -2,48 | 1.773 | -8,75 | ||||
| 2026-02-11 | 13F | Group One Trading, L.p. | Call | 2.074.400 | 0,43 | 24.582 | 0,68 | |||
| 2026-02-17 | 13F | Public Employees Retirement System Of Ohio | 1.645.932 | 1,62 | 19.504 | -4,88 | ||||
| 2026-02-13 | 13F | Resources Investment Advisors, LLC. | 10.874 | -10,73 | 129 | -16,88 | ||||
| 2026-02-17 | 13F | Banco Bilbao Vizcaya Argentaria, S.a. | 0 | -100,00 | 0 | |||||
| 2026-01-21 | 13F | SJS Investment Consulting Inc. | 659 | 0,92 | 8 | -12,50 | ||||
| 2026-02-11 | 13F | Group One Trading, L.p. | Put | 139.000 | -92,83 | 1.567 | -93,62 | |||
| 2025-09-26 | NP | FSGEX - Fidelity Series Global ex U.S. Index Fund This fund is a listed as child fund of Fmr Llc and if that institution has disclosed ownership in this security, then these positions will not be double counted when calculating total shares and total value | 9 | 0,00 | 0 | |||||
| 2026-02-11 | 13F | Comprehensive Financial Planning, Inc./PA | 100 | 1 | ||||||
| 2026-02-06 | 13F | Lsv Asset Management | 22.000 | 0,00 | 0 | |||||
| 2026-02-04 | 13F | HighPoint Advisor Group LLC | 0 | -100,00 | 0 | |||||
| 2026-02-13 | 13F | Sei Investments Co | 3.172.343 | 8,12 | 37.592 | 1,21 | ||||
| 2025-11-05 | 13F | Fullcircle Wealth Llc | 0 | -100,00 | 0 | |||||
| 2026-01-07 | 13F | Sovereign Financial Group, Inc. | 10.617 | 0,00 | 126 | -6,72 | ||||
| 2026-02-11 | 13F | Ameraudi Asset Management, Inc. | 13.850 | 0,00 | 164 | -6,29 | ||||
| 2026-02-03 | 13F | We Are One Seven, LLC | 56.274 | 10,62 | 667 | 3,42 | ||||
| 2026-02-17 | 13F | Advisor Group Holdings, Inc. | 194.642 | -32,39 | 2.306 | -36,07 | ||||
| 2026-02-11 | 13F | Simplex Trading, Llc | Call | 0 | -100,00 | 0 | ||||
| 2026-02-13 | 13F | Dodge & Cox | 31.200 | -4,59 | 370 | -10,65 | ||||
| 2026-02-11 | 13F | Simplex Trading, Llc | 0 | -100,00 | 0 | |||||
| 2025-10-16 | 13F | Kingstone Capital Partners Texas, LLC | 0 | -100,00 | 0 | -100,00 | ||||
| 2026-01-28 | 13F | Retirement Planning Co of New England, Inc. | 48.376 | 15,46 | 573 | 8,11 | ||||
| 2026-02-09 | 13F | Huntington National Bank | 5.695 | -2,50 | 67 | -8,22 | ||||
| 2026-02-11 | 13F | Simplex Trading, Llc | Put | 0 | -100,00 | 0 | ||||
| 2026-02-12 | 13F | SWAN Capital LLC | 350 | 0,00 | 4 | 0,00 | ||||
| 2026-01-22 | 13F | Massachusetts Financial Services Co /ma/ | 9.664.426 | -11,90 | 114.523 | -17,54 | ||||
| 2026-01-26 | 13F | Ckw Financial Group | 59 | 0,00 | 0 | |||||
| 2026-02-11 | 13F | Capital International Investors | 30.637.308 | 51,58 | 363.052 | 41,88 | ||||
| 2026-02-03 | 13F | Anfield Capital Management, LLC | 7.322 | 0,00 | 87 | -6,52 | ||||
| 2025-09-25 | NP | TWAAX - Thrivent International Allocation Fund Class A | 14.110 | 90,16 | 180 | 115,66 | ||||
| 2026-01-27 | 13F | GHP Investment Advisors, Inc. | 2.164 | 26 | ||||||
| 2026-02-12 | 13F | Hollencrest Capital Management | 28 | 0,00 | 0 | |||||
| 2026-02-19 | 13F | Atomi Financial Group, Inc. | 48.415 | -3,30 | 574 | -9,48 | ||||
| 2026-02-17 | 13F | Brevan Howard Capital Management LP | 0 | -100,00 | 0 | |||||
| 2026-02-13 | 13F | Rhumbline Advisers | 99.156 | -8,08 | 1.175 | -13,99 | ||||
| 2026-02-18 | 13F | Beacon Pointe Advisors, LLC | 23.289 | -36,52 | 276 | -40,73 | ||||
| 2026-02-04 | 13F | Summit Wealth Group Llc / Co | 0 | -100,00 | 0 | |||||
| 2025-09-25 | NP | Elevation Series Trust - The Opal International Dividend Income ETF | 231.416 | 16,91 | 2.948 | 31,96 | ||||
| 2026-02-17 | 13F | Farringdon Capital, Ltd. | 49.661 | -69,32 | 588 | -71,29 | ||||
| 2026-02-13 | 13F | Macquarie Group Ltd | 0 | -100,00 | 0 | |||||
| 2026-02-11 | 13F | Fore Capital, LLC | 80.000 | 948 | ||||||
| 2026-02-13 | 13F | Transamerica Financial Advisors, Inc. | 1.797 | 21 | ||||||
| 2026-02-17 | 13F | Voloridge Investment Management, Llc | 1.633.914 | -31,71 | 19.362 | -36,08 | ||||
| 2025-09-26 | NP | FTCEX - Fidelity Total International Equity Fund Fidelity Advisor Total International Equity Fund: Class C This fund is a listed as child fund of Fmr Llc and if that institution has disclosed ownership in this security, then these positions will not be double counted when calculating total shares and total value | 199.183 | 4,68 | 2.538 | 18,11 | ||||
| 2026-02-10 | 13F | Acadian Asset Management Llc | 57.234 | 141,76 | 1 | |||||
| 2026-02-17 | 13F | Fearnley Asset Management As | 399.595 | 17.590 | ||||||
| 2026-02-12 | 13F | CoreCommodity Management, LLC | 12.064 | 0,00 | 143 | -6,58 | ||||
| 2026-02-11 | 13F | Accuvest Global Advisors | 27.250 | 323 | ||||||
| 2026-02-17 | 13F | Stokes Family Office, LLC | 10.271 | 2,71 | 122 | -3,97 | ||||
| 2026-02-17 | 13F | Qube Research & Technologies Ltd | 909.787 | -30,13 | 10.781 | -34,60 | ||||
| 2026-02-02 | 13F | Chung Wu Investment Group, LLC | 3.000 | 0,00 | 36 | -5,41 | ||||
| 2026-02-17 | 13F | Capital Fund Management S.a. | 176.798 | 95,17 | 2.095 | 82,81 | ||||
| 2026-02-13 | 13F | Y-Intercept (Hong Kong) Ltd | 1.654.678 | 7,28 | 19.608 | 0,41 | ||||
| 2026-02-11 | 13F | Janney Montgomery Scott LLC | 32.965 | 4,77 | 0 | |||||
| 2026-01-15 | 13F | Founders Capital Management | 5.000 | 0,00 | 59 | -6,35 | ||||
| 2025-11-14 | 13F | AXA Investment Managers S.A. | 144.159 | 1.825 | ||||||
| 2026-01-06 | 13F | Investors Research Corp | 1.034 | -6,76 | 12 | -14,29 | ||||
| 2026-01-14 | 13F | Wolff Wiese Magana Llc | 5.000 | 0,00 | 59 | -6,35 | ||||
| 2025-09-25 | NP | DEHP - Dimensional Emerging Markets High Profitability ETF | 15.308 | 89,93 | 195 | 116,67 | ||||
| 2026-02-04 | 13F | Legacy Financial Advisors, Inc. | 0 | -100,00 | 0 | |||||
| 2026-02-17 | 13F | Cetera Investment Advisers | 434.723 | -4,76 | 5.151 | -10,85 | ||||
| 2026-02-12 | 13F | Campbell & CO Investment Adviser LLC | 63.510 | -48,50 | 753 | -51,83 | ||||
| 2026-02-13 | 13F | Cohen & Steers, Inc. | 289.410 | 51,97 | 3 | 50,00 | ||||
| 2025-09-26 | NP | UUPIX - Ultraemerging Markets Profund Investor Class | 9.082 | 18,49 | 116 | 33,72 | ||||
| 2026-02-13 | 13F | Capula Management Ltd | 164.470 | 1.949 | ||||||
| 2026-02-13 | 13F | Walleye Capital LLC | Call | 93.500 | 734,82 | 1.108 | 685,11 | |||
| 2026-02-13 | 13F | Walleye Capital LLC | Put | 99.300 | 204,60 | 1.177 | 185,44 | |||
| 2026-02-13 | 13F | Walleye Capital LLC | 154.783 | 19,77 | 1.834 | 12,10 | ||||
| 2026-01-28 | 13F | Atwood & Palmer Inc | 327 | 0,00 | 4 | -25,00 | ||||
| 2025-11-14 | 13F | Point72 Europe (London) LLP | 945.166 | -26,23 | 11.966 | -25,34 | ||||
| 2026-02-13 | 13F | Integrated Wealth Concepts LLC | 57.199 | -7,31 | 678 | -13,32 | ||||
| 2026-01-14 | 13F | TrueMark Investments, LLC | 291.680 | 14,95 | 3.456 | 7,60 | ||||
| 2026-02-13 | 13F | SRS Capital Advisors, Inc. | 9.241 | 47,31 | 110 | 37,97 | ||||
| 2026-02-09 | 13F | MQS Management LLC | 16.771 | 199 | ||||||
| 2026-02-17 | 13F | Cape Investment Advisory, Inc. | 229 | 3 | ||||||
| 2026-02-04 | 13F | Nwam Llc | 25.811 | -4,82 | 370 | 16,72 | ||||
| 2026-02-05 | 13F | Elyxium Wealth, LLC | 1.525 | 18 | ||||||
| 2026-01-30 | 13F | R Squared Ltd | 43.842 | 10,28 | 520 | 3,18 | ||||
| 2026-02-13 | 13F | BNP Paribas Asset Management Holding S.A. | 154.320 | 2 | ||||||
| 2025-09-25 | NP | DFEV - Dimensional Emerging Markets Value ETF | 247.256 | 3.150 | ||||||
| 2026-02-12 | 13F | North of South Capital LLP | 265.853 | -6,84 | 3.150 | -12,79 | ||||
| 2026-01-05 | 13F | Rosenberg Matthew Hamilton | 1.447 | 0,00 | 17 | -5,56 | ||||
| 2026-02-11 | 13F | Erste Asset Management GmbH | 0 | 0 | ||||||
| 2026-02-12 | 13F | ICICI Prudential Asset Management Co Ltd | 0 | -100,00 | 0 | |||||
| 2026-02-05 | 13F | Stephens Inc /ar/ | 41.714 | 494 | ||||||
| 2026-02-11 | 13F | Parallel Advisors, LLC | 22.125 | -5,60 | 262 | -11,49 | ||||
| 2026-02-17 | 13F | Tower Research Capital LLC (TRC) | 819 | 8,76 | 10 | 0,00 | ||||
| 2026-02-13 | 13F | Kestra Advisory Services, LLC | 0 | -100,00 | 0 | |||||
| 2025-09-25 | NP | EEMGX - MFS Emerging Markets Equity Research Fund R4 | 1.412 | 80,10 | 18 | 112,50 | ||||
| 2026-01-26 | 13F | Drum Hill Capital, LLC | 131.646 | -0,95 | 1.560 | -7,25 | ||||
| 2025-10-30 | 13F | Ridgewood Investments LLC | 74.910 | 59,09 | 656 | 11,21 | ||||
| 2026-02-10 | 13F | Goldman Sachs Group Inc | Put | 2.295.000 | 70,63 | 27.196 | 59,72 | |||
| 2026-01-05 | 13F | Park Avenue Securities Llc | 19.738 | 7,96 | 0 | |||||
| 2026-02-13 | 13F | Colony Group, LLC | 43.544 | 30,83 | 519 | 23,28 | ||||
| 2026-02-17 | 13F | Virtus Investment Advisers, Inc. | 0 | -100,00 | 0 | |||||
| 2026-02-06 | 13F | HighTower Advisors, LLC | 123.418 | 19,92 | 1.463 | 12,29 | ||||
| 2026-02-10 | 13F | Goldman Sachs Group Inc | Call | 2.070.000 | 0,00 | 24.530 | -6,40 | |||
| 2026-02-17 | 13F | Laird Norton Trust Company, Llc | 52.156 | 637 | ||||||
| 2026-02-10 | 13F | Goldman Sachs Group Inc | 13.016.686 | 93,94 | 154.248 | 81,54 | ||||
| 2026-02-12 | 13F | Steward Partners Investment Advisory, Llc | 96.646 | -17,70 | 1.145 | -22,95 | ||||
| 2026-01-09 | 13F | Park Place Capital Corp | 884 | 0,00 | 10 | -9,09 | ||||
| 2026-01-13 | 13F | Kathmere Capital Management, LLC | 35.496 | -11,13 | 421 | -16,83 | ||||
| 2026-01-29 | 13F | UMA Financial Services, Inc. | 65 | 1 | ||||||
| 2026-02-11 | 13F | Ramirez Asset Management, Inc. | 87 | 1 | ||||||
| 2026-02-13 | 13F | Natixis | 160.063 | 83,04 | 1.897 | 71,27 | ||||
| 2026-02-17 | 13F | Cresset Asset Management, LLC | 0 | -100,00 | 0 | |||||
| 2026-02-17 | 13F | Capital Fund Management S.a. | Call | 345.100 | -0,35 | 4.089 | -6,73 | |||
| 2026-02-06 | 13F | Radnor Capital Management, LLC | 16.300 | -58,52 | 193 | -61,17 | ||||
| 2026-02-13 | 13F | Evelyn Partners Investment Management LLP | 650 | 0,00 | 8 | -12,50 | ||||
| 2026-02-06 | 13F | Pnc Financial Services Group, Inc. | 56.034 | 35,66 | 664 | 27,20 | ||||
| 2026-02-11 | 13F | Cerity Partners LLC | 67.744 | 67,43 | 803 | 56,64 | ||||
| 2025-11-12 | 13F | Quantbot Technologies LP | 0 | -100,00 | 0 | |||||
| 2026-01-28 | 13F | Geneos Wealth Management Inc. | 2.000 | 0,00 | 24 | -8,00 | ||||
| 2026-02-17 | 13F | Capital Fund Management S.a. | Put | 200.300 | 9,16 | 2.374 | 2,15 | |||
| 2026-02-09 | 13F | Harbour Investments, Inc. | 1.256 | 0,00 | 15 | -6,67 | ||||
| 2026-02-12 | 13F | JBF Capital, Inc. | 62.000 | 3,33 | 699 | -1,55 | ||||
| 2025-09-23 | NP | VVIFX - Voya VACS Series EME Fund | 130.950 | -23,93 | 1.668 | -14,15 | ||||
| 2026-02-17 | 13F | Jump Financial, LLC | 774.182 | 389,99 | 9.174 | 358,70 | ||||
| 2026-01-15 | 13F | Highline Wealth Partners Llc | 1.053 | 18,45 | 12 | 9,09 | ||||
| 2026-02-04 | 13F | D'Orazio & Associates, Inc. | 12.498 | -14,43 | 148 | -19,57 | ||||
| 2026-02-12 | 13F | BlackRock, Inc. | 11.573.196 | 3,67 | 137.142 | -2,96 | ||||
| 2026-02-11 | 13F | Capital Wealth Planning, LLC | 257.372 | 37,62 | 3.068 | 29,57 | ||||
| 2026-02-05 | 13F | May Hill Capital, LLC | 0 | -100,00 | 0 | |||||
| 2026-02-13 | 13F | Vontobel Holding Ltd. | 85.551 | 98,69 | 1.014 | 85,87 | ||||
| 2025-10-08 | 13F | Retirement Wealth Solutions LLC | 0 | -100,00 | 0 | -100,00 | ||||
| 2025-11-13 | 13F | Eisler Capital Management Ltd. | 0 | -100,00 | 0 | -100,00 | ||||
| 2026-01-27 | 13F | BankPlus Trust Department | 44.000 | 521 | ||||||
| 2025-10-30 | 13F | Twin Peaks Wealth Advisors, LLC | 0 | -100,00 | 0 | |||||
| 2026-02-17 | 13F | SageView Advisory Group, LLC | 725 | 9 | ||||||
| 2026-01-16 | 13F | Standard Life Aberdeen plc | 608.893 | 112,85 | 7.215 | 96,27 | ||||
| 2026-02-13 | 13F | Inspire Advisors, LLC | 11.502 | 0,75 | 136 | -5,56 | ||||
| 2026-02-13 | 13F | Citigroup Inc | 1.738.958 | 80,30 | 20.607 | 68,76 | ||||
| 2026-02-13 | 13F | Citigroup Inc | Call | 977.800 | 14,31 | 11.587 | 6,99 | |||
| 2025-11-13 | 13F | Total Investment Management Inc | 0 | -100,00 | 0 | |||||
| 2025-09-25 | NP | IPAYX - Integrity Dividend Summit Fund Class I | 23.000 | 0,00 | 293 | 13,13 | ||||
| 2026-01-22 | 13F | Lesa Sroufe & Co | 288.600 | -8,09 | 3 | 0,00 | ||||
| 2026-02-13 | 13F | Citigroup Inc | Put | 2.435.000 | 14,32 | 28.855 | 7,01 | |||
| 2026-02-17 | 13F | Quantitative Investment Management, LLC | 0 | -100,00 | 0 | |||||
| 2026-01-12 | 13F | Seacrest Wealth Management, Llc | 66.311 | 21,77 | 765 | 15,21 | ||||
| 2026-01-30 | 13F | Sigma Planning Corp | 27.179 | -3,36 | 325 | -9,22 | ||||
| 2026-01-29 | 13F | Nbc Securities, Inc. | 1.063 | 1,14 | 13 | -14,29 | ||||
| 2026-01-30 | 13F | ARGA Investment Management, LP | 18.975.177 | 0,89 | 224.856 | -5,57 | ||||
| 2026-02-17 | 13F | CWM Advisors, LLC | 6.488 | 77 | ||||||
| 2026-01-23 | 13F | Nbt Bank N A /ny | 2.000 | 0,00 | 24 | -8,00 | ||||
| 2025-09-25 | NP | DAADX - Emerging Markets ex China Core Equity Portfolio Institutional Class | 0 | -100,00 | 0 | -100,00 | ||||
| 2026-01-07 | 13F | St. Louis Financial Planners Asset Management, LLC | 0 | -100,00 | 0 | |||||
| 2025-10-30 | 13F | Mizuho Securities Co. Ltd. | 0 | -100,00 | 0 | |||||
| 2026-02-12 | 13F | Provida Pension Fund Administrator | 0 | -100,00 | 0 | |||||
| 2026-02-10 | 13F | State of Wyoming | 59.672 | 1,93 | 707 | -4,59 | ||||
| 2026-02-11 | 13F | Winton Capital Group Ltd | 86.000 | 1.019 | ||||||
| 2026-02-12 | 13F | Groupe la Francaise | 0 | -100,00 | 0 | |||||
| 2026-02-11 | 13F | Longfellow Investment Management Co Llc | 182.307 | -13,28 | 2.160 | -18,83 | ||||
| 2026-02-17 | 13F | Signature Equity Partners, LLC | 227 | 3 | ||||||
| 2026-02-13 | 13F | Verition Fund Management LLC | 0 | -100,00 | 0 | -100,00 | ||||
| 2026-02-09 | 13F/A | Fideuram - Intesa Sanpaolo Private Banking S.p.a. | 282.562 | 3.348 | ||||||
| 2026-02-13 | 13F | Stifel Financial Corp | 248.079 | 32,71 | 2.940 | 24,22 | ||||
| 2025-09-25 | NP | Thrivent Core Funds - Thrivent Core Emerging Markets Equity Fund | 104.169 | 90,97 | 1.327 | 115,77 | ||||
| 2026-01-20 | 13F | Stratos Wealth Advisors, LLC | 0 | -100,00 | 0 | |||||
| 2026-02-18 | 13F | EP Wealth Advisors, Inc. | 0 | -100,00 | 0 | |||||
| 2026-01-15 | 13F | Shrier Wealth Management, Llc | 48.104 | 570 | ||||||
| 2025-10-22 | 13F | Hennion & Walsh Asset Management, Inc. | 0 | -100,00 | 0 | -100,00 | ||||
| 2025-09-29 | NP | TIIV - AAM Todd International Intrinsic Value ETF | 23.169 | 295 | ||||||
| 2026-02-12 | 13F | Principal Securities, Inc. | 36.379 | 27,78 | 431 | 19,72 | ||||
| 2026-01-26 | 13F | Annex Advisory Services, LLC | 2.108.579 | 5,73 | 24.987 | -1,03 | ||||
| 2025-11-14 | 13F | Sofos Investments, Inc. | 0 | -100,00 | 0 | |||||
| 2026-01-20 | 13F | Signaturefd, Llc | 31.038 | 6,58 | 368 | -0,27 | ||||
| 2026-02-06 | 13F | Profund Advisors Llc | 92.364 | 10,34 | 1.095 | 3,31 | ||||
| 2026-02-05 | 13F | Bessemer Group Inc | 13.746 | -1,11 | 0 | |||||
| 2026-02-05 | 13F | Allworth Financial LP | 12.248 | 0,60 | 145 | -5,84 | ||||
| 2025-11-14 | 13F | Binnacle Investments Inc | 634 | -5,65 | 8 | 0,00 | ||||
| 2026-02-09 | 13F | Beck Bode, LLC | Call | 0 | -100,00 | 0 | -100,00 | |||
| 2025-09-26 | NP | PCEMX - PACE International Emerging Markets Equity Investments Class P | 364.545 | 0,51 | 4.644 | 13,43 | ||||
| 2026-01-15 | 13F | Lodestone Wealth Management LLC | 1 | 0 | ||||||
| 2026-02-11 | 13F | West Family Investments, Inc. | 21.406 | -22,13 | 254 | -27,30 | ||||
| 2026-02-17 | 13F | Tudor Investment Corp Et Al | Put | 22.500 | -34,21 | 267 | -38,43 | |||
| 2026-02-17 | 13F | Tudor Investment Corp Et Al | Call | 35.500 | 85,86 | 421 | 74,27 | |||
| 2025-09-25 | NP | SEMVX - Hartford Schroders Emerging Markets Equity Fund Class A | 4.629.234 | 6,59 | 58.976 | 20,28 | ||||
| 2026-02-13 | 13F | Verition Fund Management LLC | Put | 500.600 | 0,00 | 5.932 | -6,39 | |||
| 2025-09-26 | NP | MSTSX - Morningstar Unconstrained Allocation Fund | 69.278 | 15,22 | 883 | 30,09 | ||||
| 2026-02-12 | 13F | Renaissance Technologies Llc | 9.555.200 | -9,41 | 113.229 | -15,20 | ||||
| 2026-01-30 | 13F | Cullinan Associates Inc | 33.200 | 0,00 | 393 | -6,43 | ||||
| 2026-02-13 | 13F | Cloverfields Capital Group, Lp | 226.694 | 1,53 | 2.686 | -4,95 | ||||
| 2026-02-09 | 13F | Todd Asset Management Llc | 3.059.639 | -2,47 | 36.257 | -8,71 | ||||
| 2025-09-25 | NP | PRIJX - T. Rowe Price Emerging Markets Discovery Stock Fund This fund is a listed as child fund of Price T Rowe Associates Inc /md/ and if that institution has disclosed ownership in this security, then these positions will not be double counted when calculating total shares and total value | 2.240.600 | 28.545 | ||||||
| 2026-02-11 | 13F | Metis Global Partners, LLC | 111.668 | 1,76 | 1.323 | -4,75 | ||||
| 2026-01-16 | 13F | Ronald Blue Trust, Inc. | 27.048 | -18,21 | 321 | -23,44 | ||||
| 2026-02-12 | 13F | Federation des caisses Desjardins du Quebec | 23.150 | -79,13 | 274 | -80,48 | ||||
| 2026-02-17 | 13F | Old West Investment Management, LLC | 78.040 | 925 | ||||||
| 2025-09-25 | NP | EMGAX - Wells Fargo Emerging Markets Equity Fund Class A | 522.079 | 0,00 | 6.651 | 12,84 | ||||
| 2026-02-06 | 13F | New Millennium Group LLC | 13.246 | 185,23 | 157 | 168,97 | ||||
| 2026-02-10 | 13F | Nomura Asset Management Co Ltd | 29.762 | -50,96 | 353 | -54,17 | ||||
| 2026-02-17 | 13F | Nomura Holdings Inc | 94.508 | 28,22 | 1.120 | 19,94 | ||||
| 2026-01-23 | 13F | Rsm Us Wealth Management Llc | 11.377 | -18,26 | 135 | -23,86 | ||||
| 2026-02-17 | 13F | Nomura Holdings Inc | Put | 95.000 | 0,00 | 1.126 | -6,41 | |||
| 2026-02-10 | 13F | Connor, Clark & Lunn Investment Management Ltd. | 120.783 | 1.431 | ||||||
| 2026-02-11 | 13F | J.Safra Asset Management Corp | 27.797 | 98,59 | 329 | 85,88 | ||||
| 2026-02-10 | 13F | Bank of New York Mellon Corp | 92.146 | 0,20 | 1.092 | -6,27 | ||||
| 2026-01-30 | 13F | Pekin Hardy Strauss, Inc. | 42.352 | 32,96 | 502 | 24,32 | ||||
| 2026-02-12 | 13F | Barings Llc | 73.545 | 0,00 | 872 | -6,44 | ||||
| 2026-02-13 | 13F | Pinnacle Wealth Planning Services, Inc. | 2.159 | 26 | ||||||
| 2026-02-17 | 13F | SummitTX Capital, L.P. | 64.220 | 340,38 | 761 | 313,59 | ||||
| 2026-01-29 | 13F | Obermeyer Wood Investment Counsel, Lllp | 18.423 | -58,74 | 218 | -61,42 | ||||
| 2026-02-24 | 13F | DGS Capital Management, LLC | 24.067 | -47,83 | 285 | -51,20 | ||||
| 2026-02-02 | 13F | Oppenheimer & Co Inc | 0 | -100,00 | 0 | |||||
| 2026-02-11 | 13F | Capital International Sarl | 39.177 | 0,00 | 464 | -6,26 | ||||
| 2026-02-17 | 13F | Sagefield Capital LP | 433.731 | 354,04 | 5.140 | 325,06 | ||||
| 2026-01-29 | 13F | RMG Wealth Management LLC | 10 | 0,00 | 0 | |||||
| 2026-02-13 | 13F | Umb Bank N A/mo | 0 | -100,00 | 0 | -100,00 | ||||
| 2026-01-21 | 13F | Westfuller Advisors, LLC | 6.888 | -0,88 | 84 | -5,62 | ||||
| 2026-02-11 | 13F | Empowered Funds, LLC | 17.079 | 39,53 | 202 | 31,17 | ||||
| 2026-02-17 | 13F | Schonfeld Strategic Advisors LLC | 116.030 | -50,80 | 1.375 | -53,97 | ||||
| 2026-02-13 | 13F/A | Virtus ETF Advisers LLC | 0 | -100,00 | 0 | |||||
| 2026-02-09 | 13F | Employees Retirement System of Texas | 65.509 | -69,83 | 1 | -100,00 | ||||
| 2026-02-17 | 13F | Abel Hall, LLC | 20.500 | 0,00 | 243 | -6,56 | ||||
| 2025-11-06 | 13F | Ameritas Advisory Services, LLC | 0 | -100,00 | 0 | -100,00 | ||||
| 2026-02-05 | 13F | Tucker Asset Management Llc | 50 | 1 | ||||||
| 2026-02-05 | 13F | Td Private Client Wealth Llc | 21.902 | -1,82 | 260 | -8,16 | ||||
| 2026-01-22 | 13F | HHM Wealth Advisors, LLC | 500 | 0,00 | 6 | -16,67 | ||||
| 2025-09-26 | NP | INVESCO ACTIVELY MANAGED EXCHANGE-TRADED FUND TRUST - Invesco Global Equity Net Zero ETF | 6.564 | 84 | ||||||
| 2026-02-14 | 13F | Rockefeller Capital Management L.P. | 23.986 | 42,86 | 284 | 33,96 | ||||
| 2026-01-26 | 13F | SeaBridge Investment Advisors LLC | 0 | -100,00 | 0 | -100,00 | ||||
| 2026-02-17 | 13F | Wiley Bros.-aintree Capital, Llc | 31.298 | 36,15 | 371 | 26,28 | ||||
| 2026-02-05 | 13F | Blume Capital Management, Inc. | 300 | 0,00 | 4 | 0,00 | ||||
| 2026-02-06 | 13F | Kilter Group LLC | 0 | -100,00 | 0 | |||||
| 2026-02-02 | 13F | Fifth Third Bancorp | 43.162 | -6,25 | 511 | -12,20 | ||||
| 2026-01-23 | 13F | Ritholtz Wealth Management | 183.891 | -6,95 | 2.179 | -12,87 | ||||
| 2026-01-27 | 13F | Regions Financial Corp | 53.799 | -2,01 | 638 | -8,35 | ||||
| 2026-02-17 | 13F | Warren Averett Asset Management, LLC | 14.735 | 25,00 | 175 | 16,78 | ||||
| 2025-09-24 | NP | EMQAX - Ashmore Emerging Markets Active Equity Fund CLASS A | 0 | -100,00 | 0 | -100,00 | ||||
| 2026-02-09 | 13F | Fisher Asset Management, LLC | 13.982.981 | -2,18 | 165.698 | -8,44 | ||||
| 2026-02-13 | 13F | VPR Management LLC | 132.846 | 0,00 | 1.574 | -6,37 | ||||
| 2026-02-17 | 13F | Ameriprise Financial Inc | 3.775.081 | 7,19 | 44.742 | 0,34 | ||||
| 2026-02-12 | 13F | Advisors Asset Management, Inc. | 179.867 | 13,45 | 2.131 | 6,18 | ||||
| 2026-01-29 | 13F | Nbc Securities, Inc. | Put | 10 | 1 | |||||
| 2026-02-10 | 13F | Avestar Capital, LLC | 14.523 | -40,31 | 172 | -44,16 | ||||
| 2026-01-29 | 13F | Sava Infond d.o.o. | 23.000 | 0,00 | 273 | -6,53 | ||||
| 2026-01-21 | 13F | Provident Living Financial Services, Inc. | 88.360 | 1.047 | ||||||
| 2026-01-28 | 13F | Cranbrook Wealth Management, LLC | 600 | 0,00 | 7 | 0,00 | ||||
| 2026-01-20 | 13F | Perpetual Ltd | 3.313.257 | 0,55 | 39.262 | -5,88 | ||||
| 2026-02-17 | 13F | Wellington Management Group Llp | 935.559 | 40,12 | 11.086 | 31,15 | ||||
| 2026-02-28 | 13F | Corecam Pte. Ltd. | 12.111 | 0,00 | 144 | -6,54 | ||||
| 2026-01-08 | 13F | Tuttle Tactical Management LLC | 23.055 | 273 | ||||||
| 2026-02-17 | 13F | Redwood Park Advisors LLC | 6.818 | 60,50 | 81 | 50,94 | ||||
| 2026-01-08 | 13F | Wealth Enhancement Advisory Services, Llc | 79.806 | -9,15 | 923 | -14,38 | ||||
| 2025-11-14 | 13F | Wetherby Asset Management Inc | 38.247 | -4,98 | 484 | -3,78 | ||||
| 2026-02-13 | 13F | Blueshift Asset Management, LLC | 0 | -100,00 | 0 | |||||
| 2026-02-20 | 13F | Sunbelt Securities, Inc. | 6 | 0,00 | 0 | |||||
| 2026-02-10 | 13F | Natixis Advisors, L.p. | 1.231.385 | -6,68 | 15 | -12,50 | ||||
| 2026-01-27 | 13F | Zurcher Kantonalbank (Zurich Cantonalbank) | 58.400 | 692 | ||||||
| 2026-02-13 | 13F | Aigen Investment Management, Lp | 0 | -100,00 | 0 | |||||
| 2025-11-14 | 13F | Mount Yale Investment Advisors, LLC | 0 | -100,00 | 0 | -100,00 | ||||
| 2025-10-22 | 13F | D.a. Davidson & Co. | 0 | -100,00 | 0 | -100,00 | ||||
| 2026-02-18 | 13F | GWM Advisors LLC | 12.668 | -5,09 | 150 | -10,71 | ||||
| 2026-02-17 | 13F | EFG International AG | 36.790 | 436 | ||||||
| 2026-01-22 | 13F | City Holding Co | 6.773 | 0,00 | 80 | -5,88 | ||||
| 2026-02-12 | 13F | Sprott Inc. | 0 | -100,00 | 0 | |||||
| 2026-02-05 | 13F | Everstar Asset Management, LLC | 13.177 | 17,94 | 156 | 10,64 | ||||
| 2025-09-25 | NP | DEXC - Dimensional Emerging Markets ex China Core Equity ETF | 57.550 | 18,78 | 733 | 34,00 | ||||
| 2026-02-05 | 13F | Atria Investments Llc | 25.140 | 0,89 | 298 | -5,71 | ||||
| 2026-02-20 | 13F/A | CMT Capital Markets Trading GmbH | 31.702 | -79,09 | 0 | -100,00 | ||||
| 2026-02-13 | 13F | Nfj Investment Group, Llc | 130 | 0,00 | 2 | 0,00 | ||||
| 2026-02-17 | 13F | Delaware Management Holdings, Inc. | 1.759.423 | 20.849 | ||||||
| 2025-11-14 | 13F | XTX Topco Ltd | 0 | -100,00 | 0 | -100,00 | ||||
| 2026-02-13 | 13F | Absolute Gestao de Investimentos Ltda. | 72.841 | 863 | ||||||
| 2026-02-17 | 13F | Rwc Asset Advisors (us) Llc | 0 | -100,00 | 0 | |||||
| 2026-02-12 | 13F | Rossby Financial, LCC | 11.798 | 9,16 | 140 | 2,21 | ||||
| 2026-02-12 | 13F | Skopos Labs, Inc. | 52.920 | 132,02 | 613 | 117,38 | ||||
| 2026-02-13 | 13F | Candriam Luxembourg S.C.A. | 25.741 | 0,00 | 305 | -6,15 | ||||
| 2026-02-03 | 13F | Lumbard & Kellner, LLC | 707.365 | 39,29 | 8.382 | 30,38 | ||||
| 2025-09-29 | NP | VRAI - Virtus Real Asset Income ETF | 13.126 | 19,38 | 167 | 34,68 | ||||
| 2025-11-25 | 13F | Alexander Labrunerie & Co., Inc. | 10.050 | 0,00 | 127 | 1,60 | ||||
| 2025-10-30 | 13F | Migdal Insurance & Financial Holdings Ltd. | 0 | -100,00 | 0 | |||||
| 2025-11-14 | 13F | Parallax Volatility Advisers, L.P. | 0 | -100,00 | 0 | -100,00 | ||||
| 2025-09-25 | NP | VMMSX - Vanguard Emerging Markets Select Stock Fund Investor Shares | 474.901 | -13,32 | 6.050 | -2,18 | ||||
| 2026-01-28 | 13F | WPG Advisers, LLC | 144 | 0,00 | 2 | 0,00 | ||||
| 2026-02-13 | 13F | MAI Capital Management | 3.945 | -15,78 | 47 | -22,03 | ||||
| 2025-11-14 | 13F | Vennlight Capital Management, LP | 0 | -100,00 | 0 | -100,00 | ||||
| 2025-09-25 | NP | MFWTX - MFS Global Total Return Fund A | 151.477 | -1,24 | 1.930 | 11,44 | ||||
| 2026-02-11 | 13F | J.w. Cole Advisors, Inc. | 12.671 | -9,19 | 102 | -42,61 | ||||
| 2025-11-13 | 13F | Contrarian Capital Management, L.l.c. | 0 | -100,00 | 0 | -100,00 | ||||
| 2025-09-25 | NP | Dimensional Emerging Markets Value Fund - Dimensional Emerging Markets Value Fund This fund is a listed as child fund of Dimensional Fund Advisors Lp and if that institution has disclosed ownership in this security, then these positions will not be double counted when calculating total shares and total value | 1.849.041 | 0,00 | 23.557 | 12,84 | ||||
| 2025-09-29 | NP | MPEMX - MONDRIAN EMERGING MARKETS VALUE EQUITY FUND | 35.064 | 5,43 | 447 | 18,93 | ||||
| 2026-01-08 | 13F | Brave Asset Management Inc | 0 | -100,00 | 0 | |||||
| 2026-02-13 | 13F | Caitong International Asset Management Co., Ltd | 8.351 | 924,66 | 99 | 880,00 | ||||
| 2026-01-22 | 13F | Financial Consulate, Inc | 45 | 1 | ||||||
| 2026-02-17 | 13F | Moneda S.A. Administradora General de Fondos | 394.281 | -12,12 | 4.672 | -10,53 | ||||
| 2026-02-13 | 13F | Itau Unibanco Holding S.A. | 19.828.159 | 146,57 | 234.171 | 130,02 | ||||
| 2026-02-19 | 13F | Invesco Ltd. | 27.974.691 | 55,29 | 331.500 | 45,35 | ||||
| 2026-01-15 | 13F | Foster & Motley Inc | 60.230 | -36,00 | 1 | -100,00 | ||||
| 2026-01-29 | 13F | UBS Group AG | 4.673.458 | 20,75 | 55.380 | 13,03 | ||||
| 2026-02-03 | 13F | International Assets Investment Management, Llc | 21.749 | 88,56 | 258 | 77,24 | ||||
| 2026-02-10 | 13F | Channing Global Advisors, Llc | 0 | -100,00 | 0 | |||||
| 2026-02-17 | 13F | Strategic Investment Advisors / MI | 13.741 | -18,31 | 163 | -23,58 | ||||
| 2026-02-09 | 13F | Fidelis Capital Partners, LLC | 0 | -100,00 | 0 | |||||
| 2026-02-10 | 13F | Eurizon Capital SGR S.p.A. | 83.759 | 992 | ||||||
| 2026-02-12 | 13F | New York State Common Retirement Fund | 2.579.822 | -4,54 | 30.571 | -10,65 | ||||
| 2026-01-27 | 13F | WealthCollab, LLC | 1.301 | -1,74 | 15 | -6,25 | ||||
| 2026-02-06 | 13F | Verde Servicos Internacionais S.A. | 2.400 | 0 | ||||||
| 2026-02-13 | 13F | NLB Skladi, upravljanje premozenja, d.o.o. | 312.384 | 3.702 | ||||||
| 2025-11-14 | 13F | Credit Agricole S A | 0 | -100,00 | 0 | |||||
| 2025-11-14 | 13F | Axa S.a. | 0 | -100,00 | 0 | |||||
| 2026-02-03 | 13F | NewEdge Wealth, LLC | 16.083 | -13,81 | 191 | -15,93 | ||||
| 2026-02-11 | 13F | BI Asset Management Fondsmaeglerselskab A/S | 0 | -100,00 | 0 | |||||
| 2026-01-07 | 13F | Sagespring Wealth Partners, Llc | 10.241 | -5,86 | 121 | -11,68 | ||||
| 2025-09-26 | NP | FAMKX - Fidelity Advisor Emerging Markets Fund Class A This fund is a listed as child fund of Fmr Llc and if that institution has disclosed ownership in this security, then these positions will not be double counted when calculating total shares and total value | 9.691.147 | -11,16 | 123.465 | 0,25 | ||||
| 2026-02-17 | 13F | Massar Capital Management, LP | 0 | -100,00 | 0 | |||||
| 2026-02-06 | 13F | Global Retirement Partners, LLC | 18.998 | -75,05 | 225 | -76,66 | ||||
| 2025-10-17 | 13F | Matthews International Capital Management Llc | 0 | -100,00 | 0 | -100,00 | ||||
| 2026-01-29 | 13F | UBS Group AG | Put | 3.530.900 | -2,75 | 41.841 | -8,98 | |||
| 2026-01-29 | 13F | UBS Group AG | Call | 10.211.190 | 8,05 | 121.003 | 1,13 | |||
| 2026-02-12 | 13F | Hudock, Inc. | 15.498 | 0,73 | 184 | -5,67 | ||||
| 2026-02-17 | 13F | Lazard Asset Management Llc | 23.170.764 | 7,42 | 274.574 | 0,55 | ||||
| 2026-01-15 | 13F | Nisa Investment Advisors, Llc | 1.500 | -31,82 | 19 | -35,71 | ||||
| 2026-02-17 | 13F | Price T Rowe Associates Inc /md/ | 10.389.475 | 51,54 | 123 | 43,02 | ||||
| 2026-02-13 | 13F | JustInvest LLC | 13.470 | 10,23 | 160 | 3,25 | ||||
| 2026-02-12 | 13F | Advocate Investing Services LLC | 12.400 | 147 | ||||||
| 2026-02-13 | 13F | Mml Investors Services, Llc | 57.806 | -4,66 | 685 | -10,69 | ||||
| 2026-02-17 | 13F | Snowden Capital Advisors LLC | 13.607 | 162 | ||||||
| 2026-02-17 | 13F | Engineers Gate Manager LP | 189.726 | -0,10 | 2.248 | -6,49 | ||||
| 2026-02-13 | 13F | Hudson Portfolio Management LLC | 39.650 | 26,88 | 470 | 18,73 | ||||
| 2026-02-17 | 13F | Jones Financial Companies Lllp | 24.509 | 7,42 | 290 | -2,68 | ||||
| 2026-02-18 | 13F | Mackenzie Financial Corp | 381.560 | -65,19 | 4.516 | -67,45 | ||||
| 2025-09-18 | NP | ABLD - Donoghue Forlines Yield Enhanced Real Asset ETF | 98.465 | 0,98 | 1.254 | 14,00 | ||||
| 2026-01-29 | 13F | Teachers Retirement System Of The State Of Kentucky | 1.969.030 | 0,00 | 23 | -4,17 | ||||
| 2026-02-17 | 13F | Royal Bank Of Canada | Put | 261.000 | 3.093 | |||||
| 2025-11-07 | 13F | Sierra Ocean, Llc | 0 | -100,00 | 0 | -100,00 | ||||
| 2026-02-17 | 13F | Royal Bank Of Canada | Call | 25.000 | 0,00 | 296 | -6,62 | |||
| 2025-11-04 | 13F | High Note Wealth, LLC | 0 | -100,00 | 0 | |||||
| 2026-02-17 | 13F | Royal Bank Of Canada | 512.246 | 20,54 | 6.070 | 12,83 | ||||
| 2026-02-02 | 13F | Principal Financial Group Inc | 137.994 | 18,22 | 1.635 | 10,70 | ||||
| 2026-01-26 | 13F | United Advisor Group, LLC | 19.434 | 0,03 | 230 | -6,12 | ||||
| 2026-02-13 | 13F | Cullen Capital Management, LLC | 2.271.269 | 44,09 | 26.915 | 34,87 | ||||
| 2026-02-17 | 13F | Northern Trust Corp | 1.724.470 | -9,98 | 20.435 | -15,75 | ||||
| 2025-09-26 | NP | MSTFX - Morningstar International Equity Fund | 81.481 | -64,45 | 1.038 | -64,45 | ||||
| 2026-02-17 | 13F | Limestone Investment Advisors LP | 88.461 | 24,57 | 1.048 | 16,70 | ||||
| 2026-02-13 | 13F | FORA Capital, LLC | 0 | -100,00 | 0 | |||||
| 2025-09-26 | NP | FEMSX - Fidelity Series Emerging Markets Opportunities Fund This fund is a listed as child fund of Fmr Llc and if that institution has disclosed ownership in this security, then these positions will not be double counted when calculating total shares and total value | 3.710.035 | 0,00 | 47.266 | 12,84 | ||||
| 2025-11-13 | 13F | Eisler Capital Management Ltd. | Put | 600.000 | 0,00 | 7.740 | 3,12 | |||
| 2025-11-13 | 13F | Eisler Capital Management Ltd. | Call | 300.000 | 0,00 | 3.870 | 3,12 | |||
| 2026-02-12 | 13F | Jane Street Group, Llc | Put | 3.317.500 | 216,77 | 39.312 | 196,52 | |||
| 2026-02-12 | 13F | Jane Street Group, Llc | Call | 985.600 | 96,14 | 11.679 | 83,60 | |||
| 2025-11-25 | 13F | Briaud Financial Planning, Inc | 0 | -100,00 | 0 | |||||
| 2026-02-17 | 13F | Private Advisor Group, LLC | 159.116 | -3,92 | 1.886 | -10,07 | ||||
| 2025-11-13 | 13F | Banque Cantonale Vaudoise | 0 | -100,00 | 0 | |||||
| 2026-02-12 | 13F | Jane Street Group, Llc | 1.455.710 | -28,43 | 17.250 | -33,01 | ||||
| 2026-02-13 | 13F | Hurley Capital, LLC | Call | 45 | 0,00 | 8 | -33,33 | |||
| 2026-02-13 | 13F | Wells Fargo & Company/mn | 1.157.480 | 24,40 | 13.716 | 16,44 | ||||
| 2026-02-17 | 13F | Parkwood LLC | 760.484 | 28,13 | 9 | 28,57 | ||||
| 2025-11-03 | 13F | Ballentine Partners, LLC | 0 | -100,00 | 0 | -100,00 | ||||
| 2026-02-02 | 13F | Sachetta, LLC | 0 | -100,00 | 0 | |||||
| 2026-01-21 | 13F | Yousif Capital Management, Llc | 24.063 | 0,00 | 309 | 1,32 | ||||
| 2025-11-12 | 13F | Victory Capital Management Inc | 0 | -100,00 | 0 | |||||
| 2026-02-06 | 13F | Axxcess Wealth Management, Llc | 18.055 | -2,75 | 214 | -9,36 | ||||
| 2026-02-17 | 13F | Parvin Asset Management, LLC | 12.325 | 54,06 | 146 | 44,55 | ||||
| 2026-02-20 | 13F/A | Capital Markets Trading UK LLP | 440.351 | 99,01 | 5 | 150,00 | ||||
| 2026-01-29 | 13F | Sanctuary Advisors, LLC | 109.739 | 5,86 | 1.300 | -0,91 | ||||
| 2026-02-02 | 13F | Horizon Investments, LLC | 55 | 1 | ||||||
| 2026-02-11 | 13F | Capital International Inc /ca/ | 1.942.862 | 100,73 | 23.023 | 87,89 | ||||
| 2026-02-13 | 13F | Segall Bryant & Hamill, Llc | 36.200 | 0,00 | 429 | -6,55 | ||||
| 2026-02-13 | 13F | Squarepoint Ops LLC | Put | 218.000 | -65,93 | 2.583 | -68,11 | |||
| 2026-02-13 | 13F | Squarepoint Ops LLC | 657.453 | 93,54 | 7.791 | 81,16 | ||||
| 2025-11-14 | 13F | Cubist Systematic Strategies, LLC | Call | 354.800 | 5,97 | 4.492 | 7,23 | |||
| 2025-11-14 | 13F | Cubist Systematic Strategies, LLC | 1.932.399 | 508,33 | 24.464 | 515,76 | ||||
| 2026-02-17 | 13F | Kerrisdale Advisers, LLC | 111.126 | 0,00 | 1.317 | -6,40 | ||||
| 2026-02-03 | 13F | Wesbanco Bank Inc | 0 | -100,00 | 0 | |||||
| 2026-02-17 | 13F | Balyasny Asset Management Llc | 122.559 | 1.452 | ||||||
| 2026-02-17 | 13F | Balyasny Asset Management Llc | Call | 209.300 | 8,61 | 2.480 | 1,68 | |||
| 2026-02-18 | 13F | Caitlin John, LLC | 0 | -100,00 | 0 | |||||
| 2026-01-13 | 13F | CoreCap Advisors, LLC | 461 | -69,95 | 5 | -73,68 | ||||
| 2026-02-04 | 13F | Altman Advisors, Inc. | 122.811 | -6,46 | 1.455 | -12,45 | ||||
| 2026-02-11 | 13F | Franklin Resources Inc | 635.707 | -24,35 | 7.533 | -29,19 | ||||
| 2026-02-03 | 13F | Sumitomo Mitsui DS Asset Management Company, Ltd | 11.000 | -31,25 | 130 | -35,64 | ||||
| 2026-02-05 | 13F | Cambridge Investment Research Advisors, Inc. | 165.484 | -6,96 | 2 | -50,00 | ||||
| 2026-02-17 | 13F | Balyasny Asset Management Llc | Put | 64.000 | -34,09 | 758 | -38,32 | |||
| 2026-02-17 | 13F | PharVision Advisers, LLC | 38.680 | 93,81 | 458 | 94,89 | ||||
| 2026-01-21 | 13F | Ameliora Wealth Management Ltd. | 4.000 | 0,00 | 47 | -6,00 | ||||
| 2026-02-17 | 13F | Millennium Management Llc | Call | 429.300 | 1,35 | 5.087 | -5,13 | |||
| 2026-02-17 | 13F | Millennium Management Llc | 204.714 | -46,03 | 2.426 | -49,50 | ||||
| 2026-02-11 | 13F | Fox Run Management, L.l.c. | 46.842 | -9,79 | 555 | -15,53 | ||||
| 2026-02-17 | 13F | Millennium Management Llc | Put | 25.200 | -74,85 | 299 | -76,50 | |||
| 2025-09-26 | NP | RTXAX - Tax-Managed Real Assets Fund Class A | 49.430 | 104,19 | 630 | 130,40 | ||||
| 2026-01-30 | 13F/A | M&t Bank Corp | 21.581 | 0,00 | 256 | -6,59 | ||||
| 2026-02-06 | 13F/A | Rathbone Brothers plc | 0 | -100,00 | 0 | |||||
| 2026-02-09 | 13F | Beck Bode, LLC | 1.232.786 | -0,59 | 14.609 | -6,96 | ||||
| 2026-01-30 | 13F | Mitsubishi UFJ Trust & Banking Corp | 320.149 | -37,26 | 3.794 | -41,28 | ||||
| 2026-02-23 | 13F | Virtu Financial LLC | 41.883 | 0 | ||||||
| 2026-01-15 | 13F | Frank, Rimerman Advisors LLC | 35.055 | -15,67 | 415 | -21,10 | ||||
| 2025-11-05 | 13F | Wellington Shields & Co., LLC | 0 | -100,00 | 0 | |||||
| 2026-02-05 | 13F | Gabelli Funds Llc | 35.000 | 0,00 | 415 | -6,55 | ||||
| 2026-01-27 | 13F | Checchi Capital Advisers, LLC | 23.434 | -3,74 | 278 | -10,06 | ||||
| 2026-01-29 | 13F | Rakuten Securities, Inc. | 149.213 | 41,55 | 1.768 | 32,53 | ||||
| 2026-02-06 | 13F | Abn Amro Investment Solutions | 42.100 | 312,75 | 499 | 286,05 | ||||
| 2026-02-12 | 13F | JPL Wealth Management, LLC | 0 | -100,00 | 0 | |||||
| 2025-09-23 | NP | SLANX - DWS Latin America Equity Fund Class A | 407.672 | 41,50 | 5.194 | 59,69 | ||||
| 2025-09-26 | NP | UBPIX - Ultralatin America Profund Investor Class | 37.208 | 0,30 | 474 | 13,40 | ||||
| 2025-09-25 | NP | VT - Vanguard Total World Stock Index Fund ETF Shares | 179.623 | 0,00 | 2.288 | 12,88 | ||||
| 2026-01-23 | 13F | Tyche Wealth Partners LLC | 23.963 | -6,82 | 284 | -12,92 | ||||
| 2026-02-17 | 13F | Clear Street Markets Llc | 10.900 | 0,93 | 129 | -5,15 | ||||
| 2025-09-26 | NP | FHKFX - Fidelity Series Emerging Markets Fund This fund is a listed as child fund of Fmr Llc and if that institution has disclosed ownership in this security, then these positions will not be double counted when calculating total shares and total value | 762.315 | -6,38 | 9.712 | 5,63 | ||||
| 2026-02-10 | 13F | NINE MASTS CAPITAL Ltd | 410.245 | 4.861 | ||||||
| 2025-10-28 | 13F | MAS Advisors LLC | 34.542 | 19,01 | 437 | 20,39 | ||||
| 2026-02-04 | 13F | Oxbow Advisors, LLC | 418.136 | 4.955 | ||||||
| 2026-02-10 | 13F | Hazlett, Burt & Watson, Inc. | 974 | 0,00 | 0 | |||||
| 2026-01-12 | 13F | Salem Investment Counselors Inc | 502.831 | -6,46 | 5.962 | -12,39 | ||||
| 2026-01-27 | 13F | Fundamenta Capital S.A. | 1.355.652 | 16.064 | ||||||
| 2026-02-13 | 13F | Banco Santander, S.A. | 434.136 | 196,57 | 5.145 | 177,60 | ||||
| 2026-02-02 | 13F | Truist Financial Corp | 32.726 | 2,60 | 388 | -3,97 | ||||
| 2026-01-23 | 13F | Robeco Institutional Asset Management B.V. | 6.013.197 | 3,26 | 71.256 | -3,35 | ||||
| 2026-01-23 | 13F | Assetmark, Inc | 1.174.976 | 8,71 | 13.923 | 1,75 | ||||
| 2026-01-15 | 13F | Victory Financial Group, Llc | 21.048 | -0,01 | 249 | -6,39 | ||||
| 2025-10-09 | 13F | Bartlett & Co. Wealth Management Llc | 0 | -100,00 | 0 | |||||
| 2025-09-25 | NP | DFEM - Dimensional Emerging Markets Core Equity 2 ETF | 59.036 | -24,19 | 752 | -14,45 | ||||
| 2026-01-05 | 13F | GAMMA Investing LLC | 946 | -37,31 | 11 | -42,11 | ||||
| 2026-02-17 | 13F | Advisor Group Holdings, Inc. | Call | 2 | 0 | |||||
| 2025-09-29 | NP | CVY - Invesco Zacks Multi-Asset Income ETF This fund is a listed as child fund of Invesco Ltd. and if that institution has disclosed ownership in this security, then these positions will not be double counted when calculating total shares and total value | 0 | -100,00 | 0 | -100,00 | ||||
| 2026-02-06 | 13F | Poehling Capital Management, LLC | 239.046 | 1,35 | 2.833 | -5,16 | ||||
| 2026-02-03 | 13F | Horrell Capital Management, Inc. | 500 | 0,00 | 6 | -16,67 | ||||
| 2026-02-17 | 13F | Two Sigma Advisers, Lp | 145.700 | 250,24 | 1.727 | 228,14 | ||||
| 2025-11-04 | 13F | Centric Wealth Management | 0 | -100,00 | 0 | |||||
| 2026-02-09 | 13F | Cypress Capital Management LLC (WY) | 4 | 0,00 | 0 | |||||
| 2026-01-14 | 13F | Spire Wealth Management | 7.035 | 15,75 | 83 | 9,21 | ||||
| 2026-02-11 | 13F | IMA Wealth, Inc. | 118 | 1 | ||||||
| 2026-01-14 | 13F | ORG Partners LLC | 52.283 | 2.273,26 | 619 | 2.192,59 | ||||
| 2025-11-03 | 13F | Kapitalo Investimentos Ltda | 0 | -100,00 | 0 | |||||
| 2026-01-26 | 13F | Abbington Investment Group | 309.572 | 8,06 | 3.668 | 1,16 | ||||
| 2026-02-17 | 13F | Aqr Capital Management Llc | 132.396 | 27,47 | 1.569 | 19,33 | ||||
| 2026-02-12 | 13F | Quadrant Capital Group Llc | 20.624 | -46,32 | 244 | -49,79 | ||||
| 2025-11-17 | 13F | FSA Wealth Management LLC | 68 | 0,00 | 1 | |||||
| 2025-11-14 | 13F | Gotham Asset Management, LLC | 0 | -100,00 | 0 | |||||
| 2026-01-21 | 13F | Prime Capital Investment Advisors, LLC | 93.798 | -1,29 | 1.112 | -7,57 | ||||
| 2026-02-12 | 13F | Tocqueville Asset Management L.p. | 25.675 | -7,56 | 304 | -13,39 | ||||
| 2026-02-05 | 13F | Thrivent Financial For Lutherans | 170.304 | 9,44 | 2 | 100,00 | ||||
| 2026-01-21 | 13F | Step Capital Management Pte. Ltd. | 60.000 | 676 | ||||||
| 2026-01-29 | 13F | DecisionPoint Financial, LLC | 0 | -100,00 | 0 | |||||
| 2026-02-10 | 13F | CIBC World Markets Inc. | 67.577 | 38,46 | 801 | 29,66 | ||||
| 2026-02-17 | 13F | D. E. Shaw & Co., Inc. | Put | 525.000 | 62,74 | 6.221 | 52,33 | |||
| 2026-02-17 | 13F | D. E. Shaw & Co., Inc. | 300.303 | -93,80 | 3.559 | -94,20 | ||||
| 2026-02-17 | 13F | D. E. Shaw & Co., Inc. | Call | 235.000 | -69,35 | 2.785 | -71,32 | |||
| 2026-02-17 | 13F | Janus Henderson Group Plc | 282.958 | 3.352 | ||||||
| 2026-02-05 | 13F | DnB Asset Management AS | 1.837.813 | 21.778 | ||||||
| 2026-01-29 | 13F | James Investment Research Inc | 23.219 | -12,63 | 275 | -18,15 | ||||
| 2026-02-20 | 13F/A | CMT Capital Markets Trading GmbH | Put | 779.900 | -29,76 | 9 | -35,71 | |||
| 2026-01-28 | 13F | Old National Bancorp /in/ | 0 | -100,00 | 0 | |||||
| 2026-01-29 | 13F | Deltec Asset Management Llc | 71.000 | 9,23 | 841 | 2,31 | ||||
| 2026-02-20 | 13F/A | CMT Capital Markets Trading GmbH | Call | 1.269.400 | -18,95 | 15 | -21,05 | |||
| 2025-10-06 | 13F | NWF Advisory Services Inc. | 0 | -100,00 | 0 | -100,00 | ||||
| 2026-02-05 | 13F | Sapient Capital Llc | 0 | -100,00 | 0 | |||||
| 2026-02-17 | 13F | Blair William & Co/il | 10.861 | 1.314,19 | 129 | 1.322,22 | ||||
| 2026-01-21 | 13F | Baker Ellis Asset Management LLC | 18.000 | 93,55 | 213 | 74,59 | ||||
| 2026-02-03 | 13F | Sequoia Financial Advisors, LLC | 22.507 | 15,49 | 267 | 8,13 | ||||
| 2026-02-06 | 13F | Leonteq Securities AG | Put | 600.000 | 200,00 | 7.110 | 180,81 | |||
| 2026-02-06 | 13F | Leonteq Securities AG | 215.413 | -63,77 | 2.553 | -66,10 | ||||
| 2026-02-03 | 13F | Crossmark Global Holdings, Inc. | 66.312 | -21,21 | 786 | -26,29 | ||||
| 2026-02-10 | 13F | Ted Buchan & Co | 191.403 | -25,04 | 2.268 | -29,83 | ||||
| 2025-11-10 | 13F | Kovitz Investment Group Partners, LLC | 0 | -100,00 | 0 | |||||
| 2026-02-17 | 13F | Susquehanna International Group, Llp | 2.323.782 | 87,14 | 27.537 | 75,17 | ||||
| 2026-02-17 | 13F | Susquehanna International Group, Llp | Put | 9.523.000 | -2,44 | 112.848 | -8,68 | |||
| 2026-01-08 | 13F | True Wealth Design, LLC | 519 | 41,42 | 6 | 50,00 | ||||
| 2026-02-17 | 13F | Point72 Asset Management, L.P. | 4.895.056 | 9,02 | 58.006 | 2,05 | ||||
| 2026-02-05 | 13F | Intrua Financial, LLC | 28.785 | 3,75 | 341 | -2,85 | ||||
| 2026-02-17 | 13F | PACK Private Wealth, LLC | 10.767 | -21,18 | 128 | -26,16 | ||||
| 2026-02-05 | 13F | Financial Security Advisor, Inc. | 0 | -100,00 | 0 | |||||
| 2026-02-17 | 13F | Point72 Asset Management, L.P. | Put | 372.100 | 135,36 | 4.409 | 120,34 | |||
| 2026-02-17 | 13F | Susquehanna International Group, Llp | Call | 8.866.200 | 57,85 | 105.064 | 47,75 | |||
| 2025-09-22 | NP | GSIHX - Goldman Sachs GQG Partners International Opportunities Fund Class A Shares | 71.574.470 | -0,28 | 911.859 | 12,53 | ||||
| 2026-02-17 | 13F | Point72 Asset Management, L.P. | Call | 939.500 | 268,58 | 11.133 | 245,00 | |||
| 2026-02-06 | 13F | Larson Financial Group LLC | 3.487 | -12,82 | 41 | -18,00 | ||||
| 2025-10-07 | 13F | Sonora Investment Management Group, LLC | 17.065 | -0,03 | 216 | 1,41 | ||||
| 2025-09-26 | NP | REMSX - Emerging Markets Fund Class S | 0 | -100,00 | 0 | -100,00 | ||||
| 2026-02-10 | 13F | Daiwa Securities Group Inc. | 157.123 | 182,10 | 2 | -66,67 | ||||
| 2026-02-13 | 13F | Thornburg Investment Management Inc | 344.876 | -0,42 | 4.087 | -6,80 | ||||
| 2026-02-02 | 13F | Artemis Investment Management LLP | 2.009.324 | -25,00 | 23.810 | -29,80 | ||||
| 2026-01-28 | 13F | B. Metzler seel. Sohn & Co. AG | 220.671 | -42,27 | 2.615 | -45,98 | ||||
| 2026-01-27 | 13F | Bayforest Capital Ltd | 3.259 | 39 | ||||||
| 2026-02-13 | 13F | Morgan Stanley | 12.087.833 | 23,65 | 143.241 | 15,74 | ||||
| 2025-09-25 | NP | DFCEX - Emerging Markets Core Equity Portfolio - Institutional Class This fund is a listed as child fund of Dimensional Fund Advisors Lp and if that institution has disclosed ownership in this security, then these positions will not be double counted when calculating total shares and total value | 297.124 | 0,00 | 3.785 | 12,85 | ||||
| 2025-09-25 | NP | HFCVX - Hennessy Cornerstone Value Fund Investor Class | 398.900 | 0,00 | 5.082 | 12,84 | ||||
| 2026-01-29 | 13F | Pictet Asset Management Holding SA | 0 | -100,00 | 0 | |||||
| 2026-02-13 | 13F | Level Four Advisory Services, Llc | 27.255 | -34,12 | 323 | -38,43 | ||||
| 2026-02-13 | 13F | HITE Hedge Asset Management LLC | 45.725 | -51,91 | 542 | -55,03 | ||||
| 2026-01-15 | 13F | J. Safra Sarasin Holding AG | 106.000 | 0,00 | 1.256 | -6,34 | ||||
| 2025-11-14 | 13F | Jain Global LLC | 0 | -100,00 | 0 | |||||
| 2026-01-16 | 13F | FNY Investment Advisers, LLC | 11.420 | 1.868,97 | 0 | |||||
| 2026-02-12 | 13F | Commonwealth Equity Services, Llc | 134.046 | -10,39 | 1.588 | 158.700,00 | ||||
| 2026-01-27 | 13F | TD Waterhouse Canada Inc. | 849 | 30,82 | 10 | 25,00 | ||||
| 2025-09-26 | 13F | Capital A Wealth Management, LLC | 0 | -100,00 | 0 | |||||
| 2026-02-13 | 13F | Pathstone Holdings, LLC | 27.694 | -8,32 | 328 | -14,14 | ||||
| 2026-01-27 | 13F | Evergreen Capital Management Llc | 39.541 | -38,02 | 476 | -41,43 | ||||
| 2026-01-15 | 13F | 25 Llc | 15.645 | 0,00 | 185 | -6,57 | ||||
| 2026-01-21 | 13F | Flagship Harbor Advisors, Llc | 1.209 | 14 | ||||||
| 2026-01-30 | 13F | Activest Wealth Management | 12.400 | 80,65 | 147 | 69,77 | ||||
| 2025-11-14 | 13F | Peak6 Llc | Call | 0 | -100,00 | 0 | ||||
| 2026-02-12 | 13F | Earnest Partners Llc | 5.335.330 | 9,50 | 63.224 | 2,49 | ||||
| 2026-02-06 | 13F | Ignite Planners, LLC | 0 | -100,00 | 0 | |||||
| 2025-11-14 | 13F | Graham Capital Management, L.P. | 0 | -100,00 | 0 | -100,00 | ||||
| 2026-01-06 | 13F | Nelson, Van Denburg & Campbell Wealth Management Group, LLC | 15.638 | -13,19 | 185 | -18,86 | ||||
| 2025-10-30 | 13F | Ridgewood Investments LLC | Call | 0 | -100,00 | 0 | -100,00 | |||
| 2025-09-25 | NP | NEWFX - NEW WORLD FUND INC Class A | 6.518.409 | 12,40 | 83.045 | 26,83 | ||||
| 2026-01-30 | 13F | State of New Jersey Common Pension Fund D | 706.825 | -8,73 | 8.376 | -14,57 | ||||
| 2026-01-08 | 13F | Traveka Wealth, LLC | 0 | -100,00 | 0 | |||||
| 2026-01-30 | 13F | Caldwell Trust Co | 115 | 1 | ||||||
| 2026-02-17 | 13F/A | RBF Capital, LLC | 100.000 | -16,67 | 1.185 | -21,99 | ||||
| 2026-01-05 | 13F | Union Bancaire Privee, UBP SA | 44.068 | 26,58 | 497 | 9,23 | ||||
| 2026-01-23 | 13F | Baillie Gifford & Co | 29.523.522 | -7,99 | 349.854 | -13,88 | ||||
| 2026-02-17 | 13F | Man Group plc | 598.768 | 344,18 | 7.095 | 315,89 | ||||
| 2026-02-17 | 13F | Bank Of America Corp /de/ | 13.767.405 | 61,61 | 163.144 | 51,27 | ||||
| 2026-02-09 | 13F | Hartland & Co., LLC | 2.330 | 273,40 | 28 | 285,71 | ||||
| 2026-02-17 | 13F | United Capital Financial Advisers, Llc | 19.234 | 7,96 | 228 | 0,89 | ||||
| 2026-02-04 | 13F | Abc Arbitrage Sa | 25.949 | -86,80 | 307 | -87,67 | ||||
| 2026-02-02 | 13F | Strs Ohio | 31.899 | -14,86 | 378 | -20,25 | ||||
| 2026-01-12 | 13F | Legacy Wealth Asset Management, LLC | 40.534 | 1,14 | 480 | -5,33 | ||||
| 2026-02-13 | 13F | Neuberger Berman Group LLC | 103.826 | -19,03 | 1.230 | -24,21 | ||||
| 2026-02-17 | 13F | Russell Investments Group, Ltd. | 613.801 | -50,31 | 7.274 | -53,49 | ||||
| 2026-01-29 | 13F | Aprio Wealth Management, LLC | 19.928 | 8,26 | 236 | 1,29 | ||||
| 2026-02-10 | 13F | Bnp Paribas Arbitrage, Sa | Call | 11.231 | 34,55 | 13.309 | 25,94 | |||
| 2026-02-17 | 13F | Limestone Investment Advisors LP | Put | 0 | -100,00 | 0 | ||||
| 2026-02-10 | 13F | Bnp Paribas Arbitrage, Sa | 580.110 | 196,37 | 6.874 | 177,40 | ||||
| 2026-02-02 | 13F | Advisors Preferred, LLC | 20.609 | -89,50 | 246 | -90,10 | ||||
| 2026-02-05 | 13F | Bank Julius Baer & Co. Ltd, Zurich | 163.600 | -3,76 | 1.939 | -9,94 | ||||
| 2026-02-09 | 13F | IPG Investment Advisors LLC | 185.185 | -51,28 | 2.260 | -53,92 | ||||
| 2026-02-10 | 13F | Bnp Paribas Arbitrage, Sa | Put | 11.042 | 5,95 | 13.085 | -0,83 | |||
| 2026-02-13 | 13F | American Century Companies Inc | 3.423.333 | 13,42 | 40.566 | 6,16 | ||||
| 2025-10-10 | 13F | Viking Fund Management Llc | 0 | -100,00 | 0 | |||||
| 2026-02-04 | 13F | Fourth Dimension Wealth, LLC | 600 | 0,00 | 7 | 0,00 | ||||
| 2026-02-17 | 13F | Creative Planning | 185.973 | 32,84 | 2.204 | 24,32 | ||||
| 2026-01-22 | 13F | Comprehensive Money Management Services LLC | 20.725 | 1,32 | 246 | -5,04 | ||||
| 2026-02-13 | 13F | Toroso Investments, LLC | 135.675 | 42,66 | 1.608 | 33,47 | ||||
| 2026-02-03 | 13F | Plan Group Financial, LLC | 0 | -100,00 | 0 | |||||
| 2026-02-17 | 13F | Quadrature Capital Ltd | 372.338 | 59,87 | 4.412 | 49,71 | ||||
| 2026-02-11 | 13F | LPL Financial LLC | 462.738 | 33,21 | 5.483 | 24,70 | ||||
| 2026-01-26 | 13F | Mirae Asset Global Investments Co., Ltd. | 105.031 | 3,04 | 1.245 | -3,57 | ||||
| 2026-02-12 | 13F | CIBC Private Wealth Group, LLC | 765 | 6,55 | 9 | 0,00 | ||||
| 2025-11-21 | 13F | Bell Investment Advisors, Inc | 0 | -100,00 | 0 | -100,00 | ||||
| 2026-02-05 | 13F | Baader Bank INC | 0 | -100,00 | 0 | |||||
| 2025-09-26 | NP | RMYAX - Multi-Strategy Income Fund Class A | 11.551 | -34,79 | 147 | -26,13 | ||||
| 2026-02-12 | 13F | Sagil Capital Llp | 611.224 | 7.243 | ||||||
| 2026-02-12 | 13F | Sagil Capital Llp | Call | 350.000 | 4.148 | |||||
| 2025-10-31 | 13F | Whittier Trust Co Of Nevada Inc | 0 | -100,00 | 0 | |||||
| 2026-02-11 | 13F | Deutsche Bank Ag\ | 6.661 | 9,52 | 79 | 2,63 | ||||
| 2026-02-17 | 13F | Grantham, Mayo, Van Otterloo & Co. LLC | 24.048 | -16,46 | 285 | -21,98 | ||||
| 2026-02-13 | 13F | Maven Securities LTD | 54.818 | 650 | ||||||
| 2026-02-17 | 13F | Breakout Capital Partners, LP | 1.182.589 | 14.014 | ||||||
| 2026-02-12 | 13F | Ci Investments Inc. | 582.509 | -64,77 | 6.903 | 34.410,00 | ||||
| 2026-02-13 | 13F | GQG Partners LLC | 136.003.212 | -35,83 | 1.611.638 | -39,94 | ||||
| 2026-02-13 | 13F | Parkside Financial Bank & Trust | 4.544 | 264,10 | 54 | 253,33 | ||||
| 2026-02-13 | 13F | PCM Encore, LLC | 20.028 | 237 | ||||||
| 2026-02-17 | 13F | Limestone Investment Advisors LP | Call | 0 | -100,00 | 0 | ||||
| 2026-02-09 | 13F | Key FInancial Inc | 453 | 5 | ||||||
| 2026-01-29 | 13F | Quest 10 Wealth Builders, Inc. | 0 | -100,00 | 0 | |||||
| 2025-09-25 | NP | TIER - T. Rowe Price International Equity Research ETF | 2.058 | 26 | ||||||
| 2026-02-13 | 13F | Smartleaf Asset Management LLC | 712 | 0,00 | 8 | -11,11 | ||||
| 2026-02-10 | 13F | Rothschild Investment Llc | 450 | 0,00 | 5 | 0,00 | ||||
| 2025-11-14 | 13F | Hrt Financial Lp | 0 | -100,00 | 0 | |||||
| 2025-11-14 | 13F | Wood Tarver Financial Group, LLC | 0 | -100,00 | 0 | |||||
| 2026-02-10 | 13F | Envestnet Asset Management Inc | 1.004.074 | -7,63 | 11.898 | -13,54 | ||||
| 2026-02-18 | 13F | Vident Advisory, LLC | 116.497 | -9,16 | 1.380 | -14,97 | ||||
| 2026-02-13 | 13F | Centiva Capital, LP | 0 | -100,00 | 0 | |||||
| 2026-02-10 | 13F | Bnp Paribas | 4.240 | 0,00 | 50 | -5,66 | ||||
| 2026-02-12 | 13F | DRW Securities, LLC | 203.796 | 207,50 | 2.415 | 188,41 | ||||
| 2025-11-14 | 13F | Wolverine Trading, Llc | Put | 396.600 | 366,59 | 5.096 | 384,41 | |||
| 2026-01-20 | 13F | SOA Wealth Advisors, LLC. | 600 | 0,00 | 7 | 0,00 | ||||
| 2026-01-23 | 13F | U.S. Capital Wealth Advisors, LLC | 14.200 | -1,39 | 168 | -7,69 | ||||
| 2026-02-12 | 13F | Brinker Capital Investments, LLC | 101.951 | 9,54 | 1.208 | 2,55 | ||||
| 2026-01-15 | 13F | Archford Capital Strategies, LLC | 88.934 | -18,16 | 1.054 | -23,42 | ||||
| 2026-02-06 | 13F | IFP Advisors, Inc | 1.003 | 0,00 | 12 | -8,33 | ||||
| 2025-09-25 | NP | JEMA - JPMorgan Emerging Markets Equity Core ETF | 665.768 | -3,20 | 8.482 | 9,22 | ||||
| 2026-02-12 | 13F/A | Pinebridge Investments Llc | 161.949 | 1.919 | ||||||
| 2026-02-12 | 13F | Dimensional Fund Advisors Lp | 3.184.306 | 1,60 | 37.734 | -5,00 | ||||
| 2026-02-14 | 13F | Whipplewood Advisors, LLC | 177 | 2 | ||||||
| 2025-11-14 | 13F | Wolverine Trading, Llc | 106.785 | 53,29 | 1.372 | 59,16 | ||||
| 2026-02-09 | 13F | Hantz Financial Services, Inc. | 40.130 | -5,89 | 0 | |||||
| 2025-11-14 | 13F | Wolverine Trading, Llc | Call | 195.700 | -28,45 | 2.515 | -25,73 | |||
| 2026-02-03 | 13F | McIlrath & Eck, LLC | 11.287 | 134 | ||||||
| 2026-02-11 | 13F | First Command Advisory Services, Inc. | 134 | 2 | ||||||
| 2026-02-12 | 13F | Resurgent Financial Advisors LLC | 15.526 | -0,60 | 184 | -7,11 | ||||
| 2026-02-09 | 13F | Morningstar Investment Management LLC | 214.987 | -30,04 | 3 | -33,33 | ||||
| 2026-02-17 | 13F | Two Sigma Securities, Llc | 20.194 | -47,36 | 239 | -50,72 | ||||
| 2026-01-09 | 13F | SG Americas Securities, LLC | 46.329 | -41,71 | 1 | -100,00 | ||||
| 2026-02-13 | 13F | National Bank Of Canada /fi/ | 546 | -68,29 | 6 | -71,43 | ||||
| 2025-11-12 | 13F | HAP Trading, LLC | Put | 18.300 | 5 | |||||
| 2026-02-17 | 13F | Mercer Global Advisors Inc /adv | 13.178 | -19,60 | 156 | -24,64 | ||||
| 2026-02-20 | 13F/A | Capital Markets Trading UK LLP | Put | 1.654.300 | 20,72 | 20 | 11,76 | |||
| 2026-02-20 | 13F/A | Capital Markets Trading UK LLP | Call | 1.600.000 | 61,23 | 19 | 58,33 | |||
| 2025-11-06 | 13F | Midwest Trust Co | 0 | -100,00 | 0 | |||||
| 2025-11-12 | 13F | HAP Trading, LLC | Call | 14.100 | 7 | |||||
| 2026-02-10 | 13F | Savant Capital, LLC | 15.699 | -8,41 | 186 | -14,29 | ||||
| 2026-02-13 | 13F | Mariner, LLC | 81.131 | 110,24 | 961 | 96,93 | ||||
| 2026-01-28 | 13F | Eagle Global Advisors Llc | 0 | -100,00 | 0 | |||||
| 2026-02-17 | 13F | Raymond James Financial Inc | 503.374 | 11,84 | 5.965 | 4,69 | ||||
| 2025-09-25 | NP | PRLAX - T. Rowe Price Latin America Fund This fund is a listed as child fund of Price T Rowe Associates Inc /md/ and if that institution has disclosed ownership in this security, then these positions will not be double counted when calculating total shares and total value | 696.277 | 9,62 | 8.871 | 23,69 | ||||
| 2026-02-13 | 13F | Schroder Investment Management Group | 23.380.819 | -17,03 | 277.063 | -22,34 | ||||
| 2026-02-12 | 13F | Qtron Investments LLC | 0 | -100,00 | 0 | |||||
| 2026-02-17 | 13F | Trexquant Investment LP | 656.749 | -34,65 | 7.782 | -38,84 | ||||
| 2025-11-14 | 13F | PineBridge Investments, L.P. | 202.110 | 0,00 | 2.559 | 1,19 | ||||
| 2026-02-12 | 13F | Brown Brothers Harriman & Co | 586 | 75,45 | 7 | 50,00 | ||||
| 2026-02-04 | 13F | LRI Investments, LLC | 1.000 | 0,00 | 12 | -8,33 | ||||
| 2025-10-27 | 13F | Kiker Wealth Management, LLC | 0 | -100,00 | 0 | -100,00 | ||||
| 2025-11-13 | 13F | Hsbc Holdings Plc | 1.078.853 | 23,45 | 13.656 | 24,92 | ||||
| 2025-11-13 | 13F | Hsbc Holdings Plc | Call | 175.700 | -5,89 | 2.221 | -4,93 | |||
| 2025-11-13 | 13F | Hsbc Holdings Plc | Put | 526.500 | -3,31 | 6.655 | -2,31 | |||
| 2026-01-29 | 13F | Vanguard Group Inc | 1.221.885 | 5,68 | 14.479 | -1,08 | ||||
| 2025-09-24 | NP | DAINX - Dunham International Stock Fund Class A | 0 | -100,00 | 0 | -100,00 | ||||
| 2026-01-16 | 13F | Ellsworth Advisors, LLC | 458.421 | 5.781 | ||||||
| 2025-11-13 | 13F | Diametric Capital, LP | 0 | -100,00 | 0 | |||||
| 2026-02-13 | 13F | Marshall Wace, Llp | 0 | -100,00 | 0 | |||||
| 2025-09-24 | NP | EQNAX - MFS Equity Income Fund A | 165.730 | 0,00 | 2.111 | 12,83 | ||||
| 2026-01-29 | 13F | Kestra Private Wealth Services, Llc | 12.037 | 0,74 | 143 | -5,96 | ||||
| 2026-02-19 | 13F | CI Private Wealth, LLC | 48.623 | -17,10 | 563 | -24,26 | ||||
| 2026-01-23 | 13F | Farther Finance Advisors, LLC | 34.460 | 25,44 | 408 | 17,58 | ||||
| 2026-02-17 | 13F | Quantinno Capital Management LP | 138.736 | 64,04 | 1.644 | 53,64 | ||||
| 2025-09-26 | NP | RAZAX - Multi-Asset Growth Strategy Fund Class A | 28.548 | -32,83 | 364 | -24,22 | ||||
| 2026-01-27 | 13F | Krilogy Financial LLC | 0 | -100,00 | 0 | |||||
| 2026-02-11 | 13F | RWC Asset Management LLP | 494.705 | -46,48 | 5.862 | -49,90 | ||||
| 2026-01-30 | 13F | Samalin Investment Counsel, LLC | 16.256 | 17,28 | 193 | 9,71 | ||||
| 2025-10-10 | 13F | Sound Income Strategies, LLC | 0 | -100,00 | 0 | |||||
| 2026-02-12 | 13F | Bank Of Montreal /can/ | 49.454 | -30,65 | 586 | -35,03 | ||||
| 2026-01-20 | 13F | AdvisorNet Financial, Inc | 1.768 | 0,00 | 21 | -9,09 | ||||
| 2026-01-23 | 13F | Lester Murray Antman dba SimplyRich | 34.094 | 17,70 | 0 | |||||
| 2026-02-12 | 13F | Raiffeisen Bank International AG | 90.000 | 1.067 | ||||||
| 2026-02-17 | 13F | LMR Partners LLP | 175.000 | 2.074 | ||||||
| 2025-11-14 | 13F | Capstone Investment Advisors, Llc | 33.948 | 430 | ||||||
| 2026-02-17 | 13F | LMR Partners LLP | Call | 40.700 | 482 | |||||
| 2026-02-17 | 13F | LMR Partners LLP | Put | 188.900 | 2.238 | |||||
| 2026-02-17 | 13F | Aspen Grove Capital, LLC | 0 | -100,00 | 0 | |||||
| 2026-02-06 | 13F | Cullen/frost Bankers, Inc. | 578 | 1,76 | 7 | -14,29 | ||||
| 2026-02-13 | 13F | SPX Equities Gestao de Recursos Ltda | 4.887.558 | -38,26 | 57.918 | -42,21 | ||||
| 2026-02-12 | 13F | BRYN MAWR TRUST Co | 0 | -100,00 | 0 | -100,00 | ||||
| 2026-02-12 | 13F | Wealthspire Advisors, LLC | 0 | -100,00 | 0 | |||||
| 2026-01-28 | 13F | CAPROCK Group, Inc. | 104.497 | -5,18 | 1.272 | -10,55 | ||||
| 2026-01-27 | 13F | Hennessy Advisors Inc | 372.000 | -5,30 | 4.408 | -11,34 | ||||
| 2025-11-14 | 13F | Cubist Systematic Strategies, LLC | Put | 118.300 | -50,56 | 1.498 | -49,98 | |||
| 2026-02-06 | 13F | Kingdom Financial Group LLC. | 0 | 0 | ||||||
| 2026-02-13 | 13F | Allie Family Office LLC | 13.860 | 0,00 | 164 | -6,82 | ||||
| 2026-02-17 | 13F | Guggenheim Capital Llc | 148.453 | 7,88 | 1.759 | 0,98 | ||||
| 2025-10-08 | 13F | FCG Investment Co | 0 | -100,00 | 0 | |||||
| 2026-02-17 | 13F | Opal Capital Llc | 291.680 | 3.456 | ||||||
| 2025-09-29 | NP | AIM INVESTMENT FUNDS (INVESCO INVESTMENT FUNDS) - Invesco Oppenheimer Developing Markets Fund Class R6 | 12.644.649 | 75,60 | 161.093 | 98,15 | ||||
| 2026-01-30 | 13F | Bogart Wealth, LLC | 350 | 0,00 | 4 | 0,00 | ||||
| 2026-02-09 | 13F | Prospera Financial Services Inc | 24.235 | -20,28 | 287 | -25,26 | ||||
| 2026-02-11 | 13F | O'shaughnessy Asset Management, Llc | 936.025 | -6,75 | 11.092 | -12,72 | ||||
| 2026-02-13 | 13F | Edgestream Partners, L.P. | 18.791 | 223 | ||||||
| 2026-02-13 | 13F | Ubs Asset Management Americas Inc | 995 | 12 | ||||||
| 2026-02-17 | 13F | Ancora Advisors, LLC | 836 | 77,12 | 10 | 80,00 | ||||
| 2026-02-17 | 13F | Evergreen Quality Fund GP, Ltd. | 472.600 | 5.600 | ||||||
| 2026-01-21 | 13F | Naviter Wealth, LLC | 24.224 | -5,73 | 296 | -10,88 | ||||
| 2026-02-11 | 13F | Vise Technologies, Inc. | 44.031 | 2,95 | 522 | -3,70 | ||||
| 2026-01-14 | 13F | Net Worth Advisory Group | 13.942 | 4,49 | 165 | -1,79 | ||||
| 2025-09-26 | NP | EPEM - Harbor Emerging Markets Equity ETF | 4.390 | 56 | ||||||
| 2026-02-11 | 13F | Jpmorgan Chase & Co | 12.624.850 | 41,02 | 149.604 | 32,00 | ||||
| 2026-02-11 | 13F | Jpmorgan Chase & Co | Call | 3.050.000 | 154,17 | 36.142 | 137,90 | |||
| 2026-01-28 | 13F | Financial Perspectives, Inc | 1.764 | 0,00 | 21 | -9,09 | ||||
| 2026-02-09 | 13F | Arista Wealth Management, LLC | 0 | -100,00 | 0 | |||||
| 2026-02-11 | 13F | Jpmorgan Chase & Co | Put | 4.766.800 | 128,35 | 56.487 | 113,74 | |||
| 2026-01-29 | 13F | IMC-Chicago, LLC | 81.351 | -47,91 | 964 | -51,24 | ||||
| 2026-02-13 | 13F | Arkadios Wealth Advisors | 26.579 | 6,32 | 315 | -0,63 | ||||
| 2025-09-26 | NP | AEMGX - Acadian Emerging Markets Portfolio Investor Class Shares | 221.386 | 354,79 | 2.820 | 306,34 | ||||
| 2026-01-29 | 13F | IMC-Chicago, LLC | Put | 283.300 | -24,35 | 3.357 | -29,19 | |||
| 2026-01-29 | 13F | IMC-Chicago, LLC | Call | 253.700 | 508,39 | 3.006 | 470,40 | |||
| 2026-02-13 | 13F | Barclays Plc | 1.326.699 | 114,83 | 15.721 | 101,09 | ||||
| 2026-02-04 | 13F | Colonial River Wealth Management, LLC | 18.055 | -2,75 | 214 | -9,36 | ||||
| 2026-02-17 | 13F | Amundi | 441.659 | 5.234 | ||||||
| 2026-02-12 | 13F | Robotti Robert | 50.000 | 0,00 | 592 | -6,48 | ||||
| 2025-09-25 | NP | DFAE - Dimensional Emerging Core Equity Market ETF | 103.050 | 0,00 | 1.313 | 12,81 | ||||
| 2026-01-30 | 13F | Us Bancorp \de\ | 30.696 | -20,25 | 364 | -25,46 | ||||
| 2026-01-26 | 13F | Cwm, Llc | 9.212 | -17,77 | 0 | |||||
| 2026-02-02 | 13F | Oppenheimer Asset Management Inc. | 320.131 | -6,83 | 3.794 | -12,78 | ||||
| 2025-11-14 | 13F | Dark Forest Capital Management Lp | 49.950 | 0,00 | 625 | 0,00 | ||||
| 2026-02-17 | 13F | Zacks Investment Management | 10.323 | 0,00 | 122 | -6,15 | ||||
| 2025-09-23 | NP | IEMGX - Voya Multi-Manager Emerging Markets Equity Fund Class I | 114.534 | -17,33 | 1.459 | -6,71 | ||||
| 2025-10-08 | 13F | Patriot Financial Group Insurance Agency, LLC | 0 | -100,00 | 0 | -100,00 | ||||
| 2026-01-30 | 13F | Archer Investment Corp | 0 | -100,00 | 0 | |||||
| 2025-09-24 | NP | SNTKX - Steward International Enhanced Index Fund Class A | 25.860 | 0,00 | 329 | 13,06 | ||||
| 2026-01-30 | 13F | Glenorchy Capital Ltd | 47.161 | 8,12 | 559 | 1,09 | ||||
| 2026-02-13 | 13F | State Street Corp | 5.485.921 | -2,73 | 66.958 | -6,76 | ||||
| 2025-09-25 | NP | HFIGX - Hartford Schroders Diversified Growth Fund Class I | 3.983 | -1,97 | 51 | 11,11 | ||||
| 2025-09-25 | NP | HRLIX - The Hartford Global Real Asset Fund Class I | 20.829 | -41,67 | 265 | -34,24 | ||||
| 2026-02-02 | 13F | Robertson Stephens Wealth Management, LLC | 36.506 | 143,28 | 444 | 133,16 | ||||
| 2026-01-28 | 13F | N.E.W. Advisory Services LLC | 400 | 0,00 | 5 | -20,00 | ||||
| 2026-01-29 | 13F | Nbc Securities, Inc. | Call | 0 | -100,00 | 0 | ||||
| 2026-02-17 | 13F | MIRAE ASSET GLOBAL ETFS HOLDINGS Ltd. | 81.175 | 18,26 | 962 | 10,71 | ||||
| 2026-02-13 | 13F | Walleye Trading LLC | 0 | -100,00 | 0 | -100,00 | ||||
| 2026-02-17 | 13F | Fmr Llc | 4.173.476 | -86,29 | 49.456 | -87,17 | ||||
| 2026-02-17 | 13F | Aquatic Capital Management LLC | 0 | -100,00 | 0 | |||||
| 2026-02-12 | 13F | Insigneo Advisory Services, Llc | 157.519 | -25,34 | 1.867 | -30,11 | ||||
| 2025-09-29 | NP | AIM INVESTMENT FUNDS (INVESCO INVESTMENT FUNDS) - Invesco Oppenheimer Global Allocation Fund Class R | 0 | -100,00 | 0 | -100,00 |